
Problem
What needed to be understood or measured
Crack detection answers whether damage is visible. Verification asks whether a later image corresponds to the same pattern, a necessary identity step before longitudinal comparison.
My contribution
My contribution
I led the study as first author, developing the metric-learning workflow, preparing triplets, and evaluating the verification model with my co-authors.
Experimental setup
Data and setup
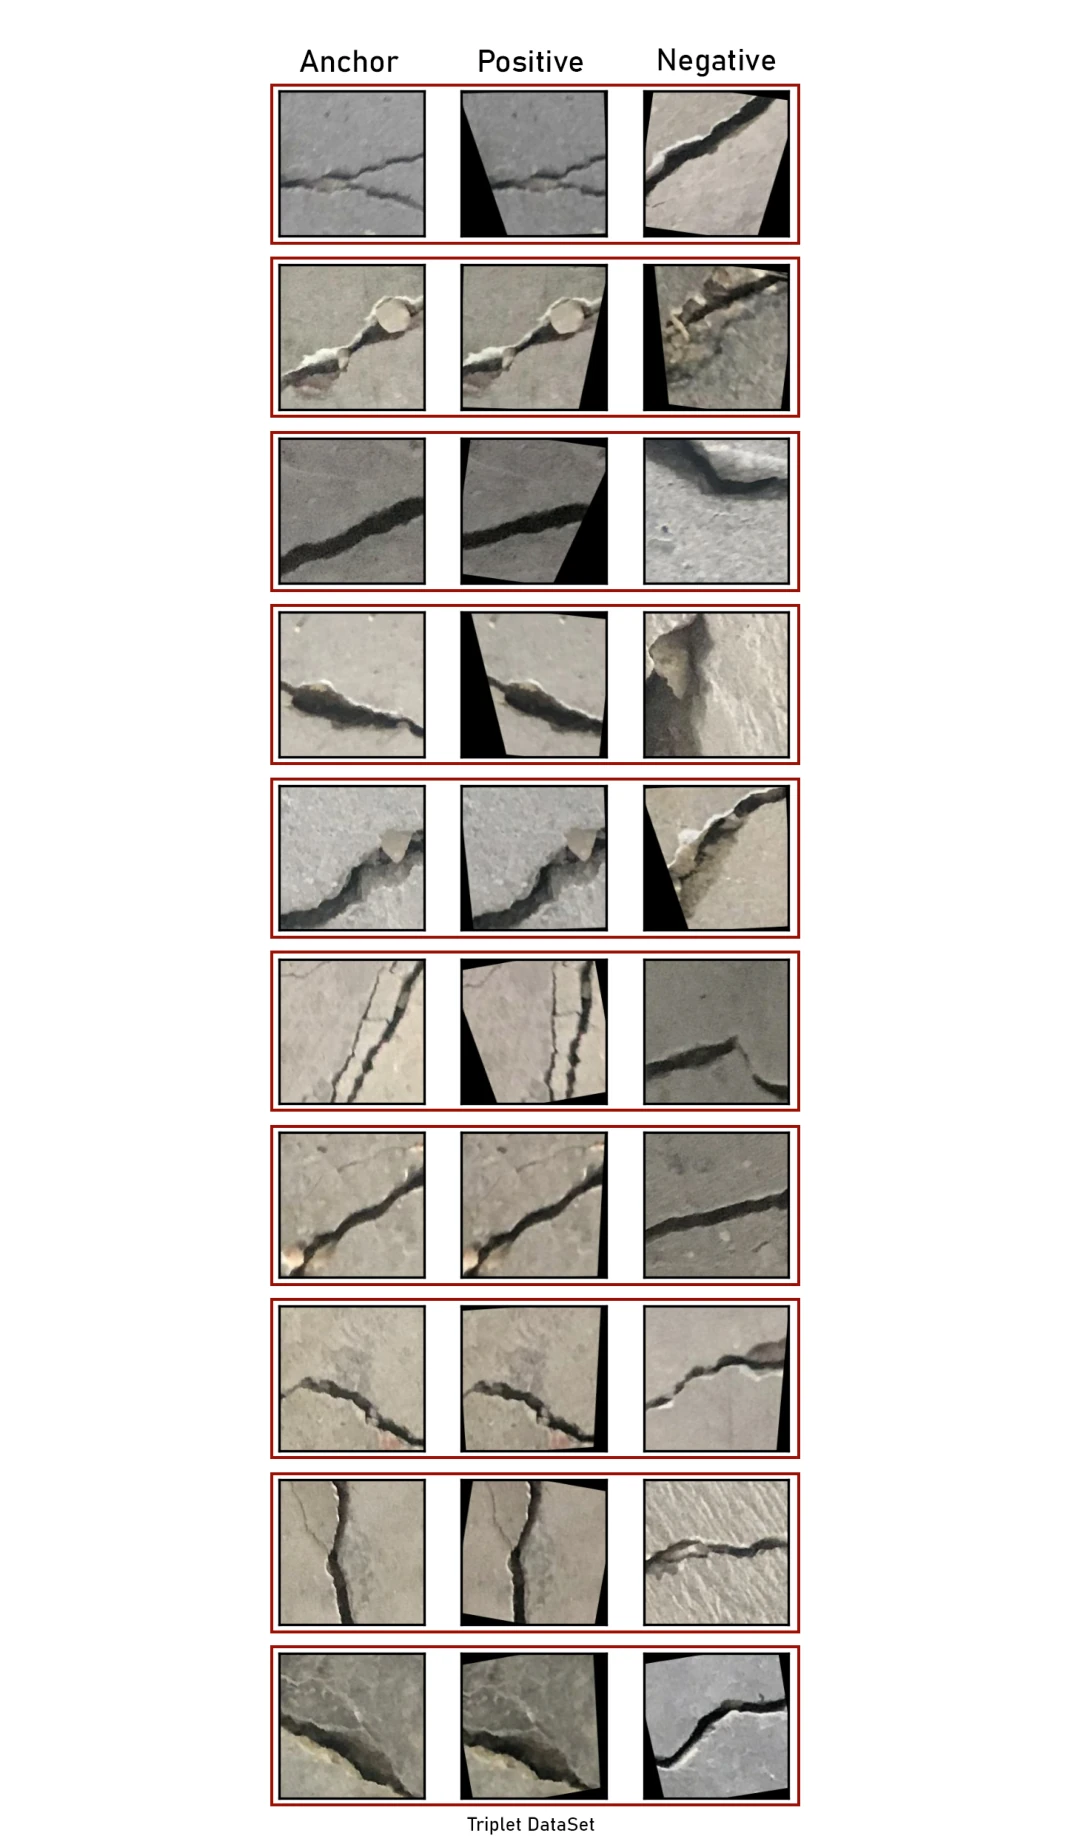
20,000 source images prepared as triplets: 12,000 for training, 3,000 for validation, and 5,000 for testing. Positive pairs were transformed versions of anchors; negatives showed different cracks.
 Open figure —
Prepared anchor, positive and negative crack triplets used to construct the verification benchmark.
Triplet Loss-Based Concrete Crack Verification, Fig. 3, p. 4.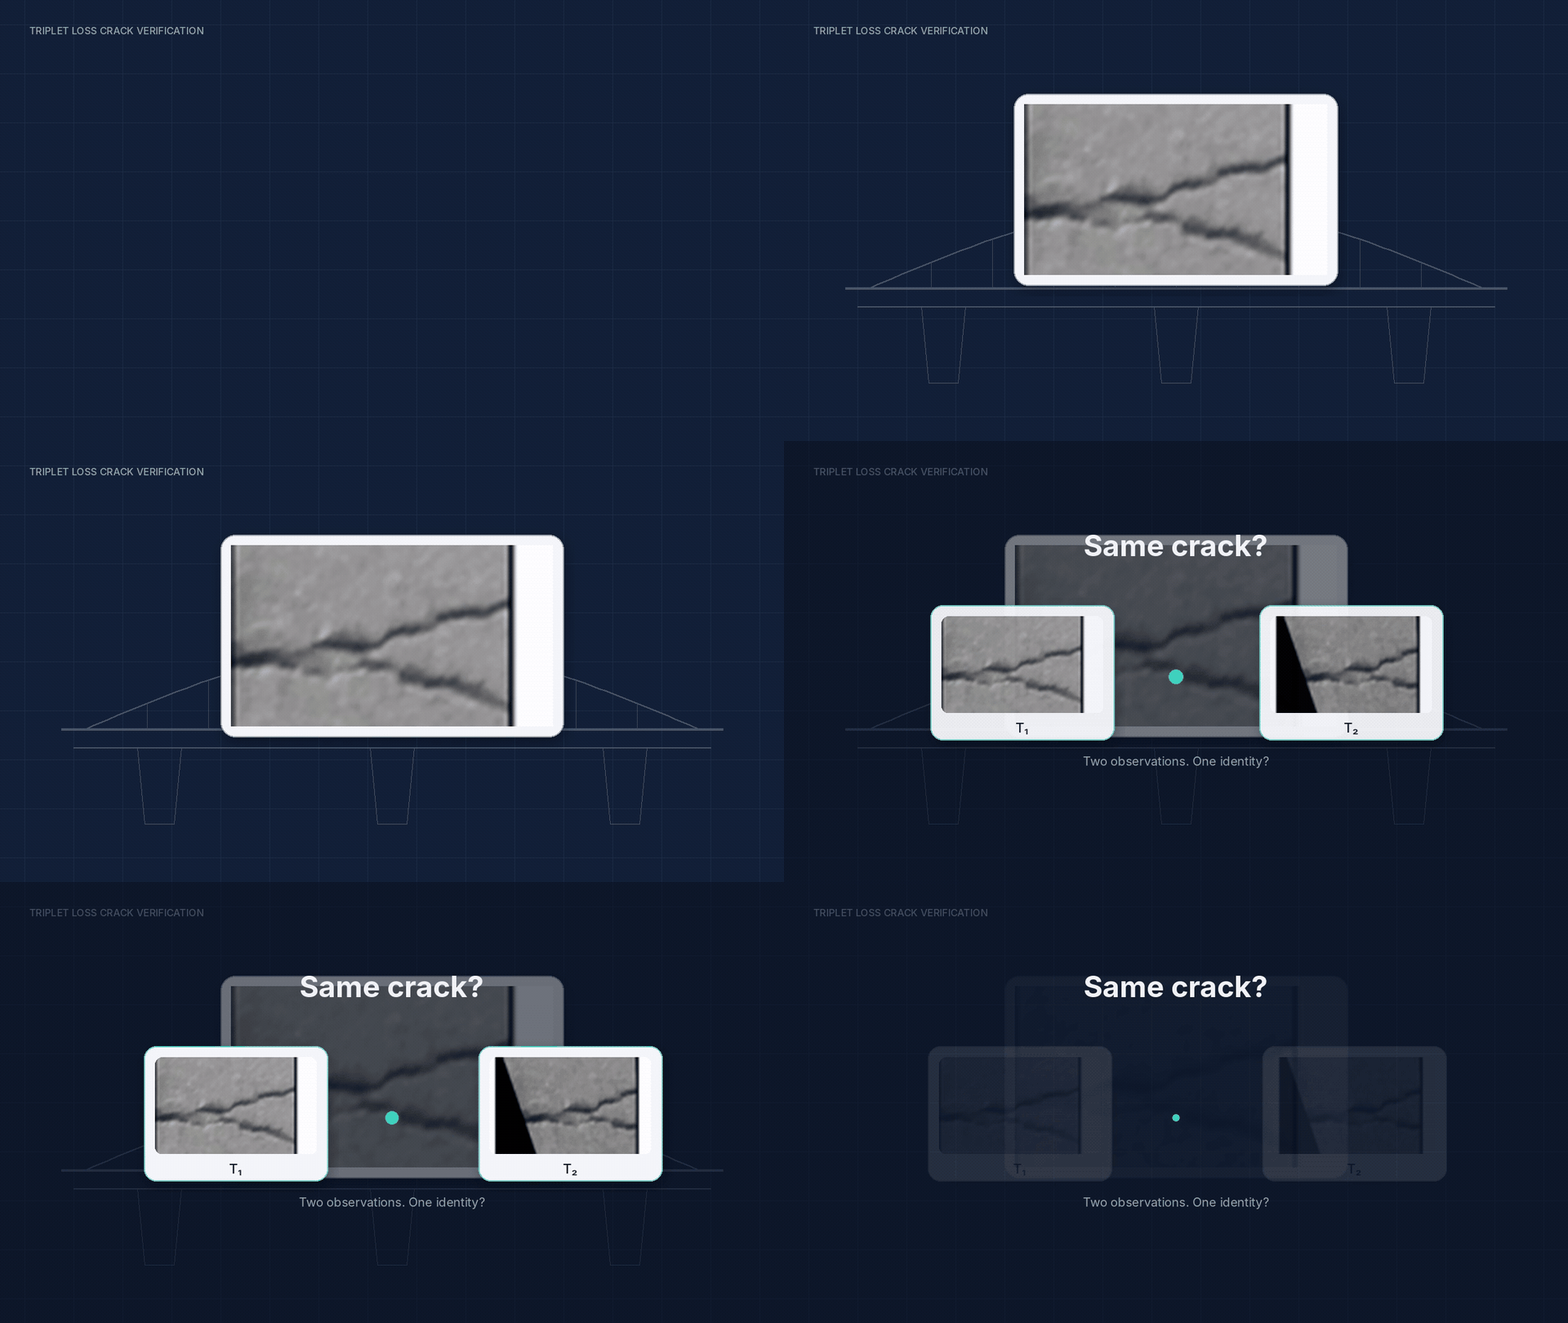 Open figure —
Introduces why matching a crack across observations requires verification beyond detecting cracks in individual images.
A8neyestani/triplet_crack_verification, assets/motion/01_problem.gif; MIT-licensed repository media.Method
From input to interpretable output
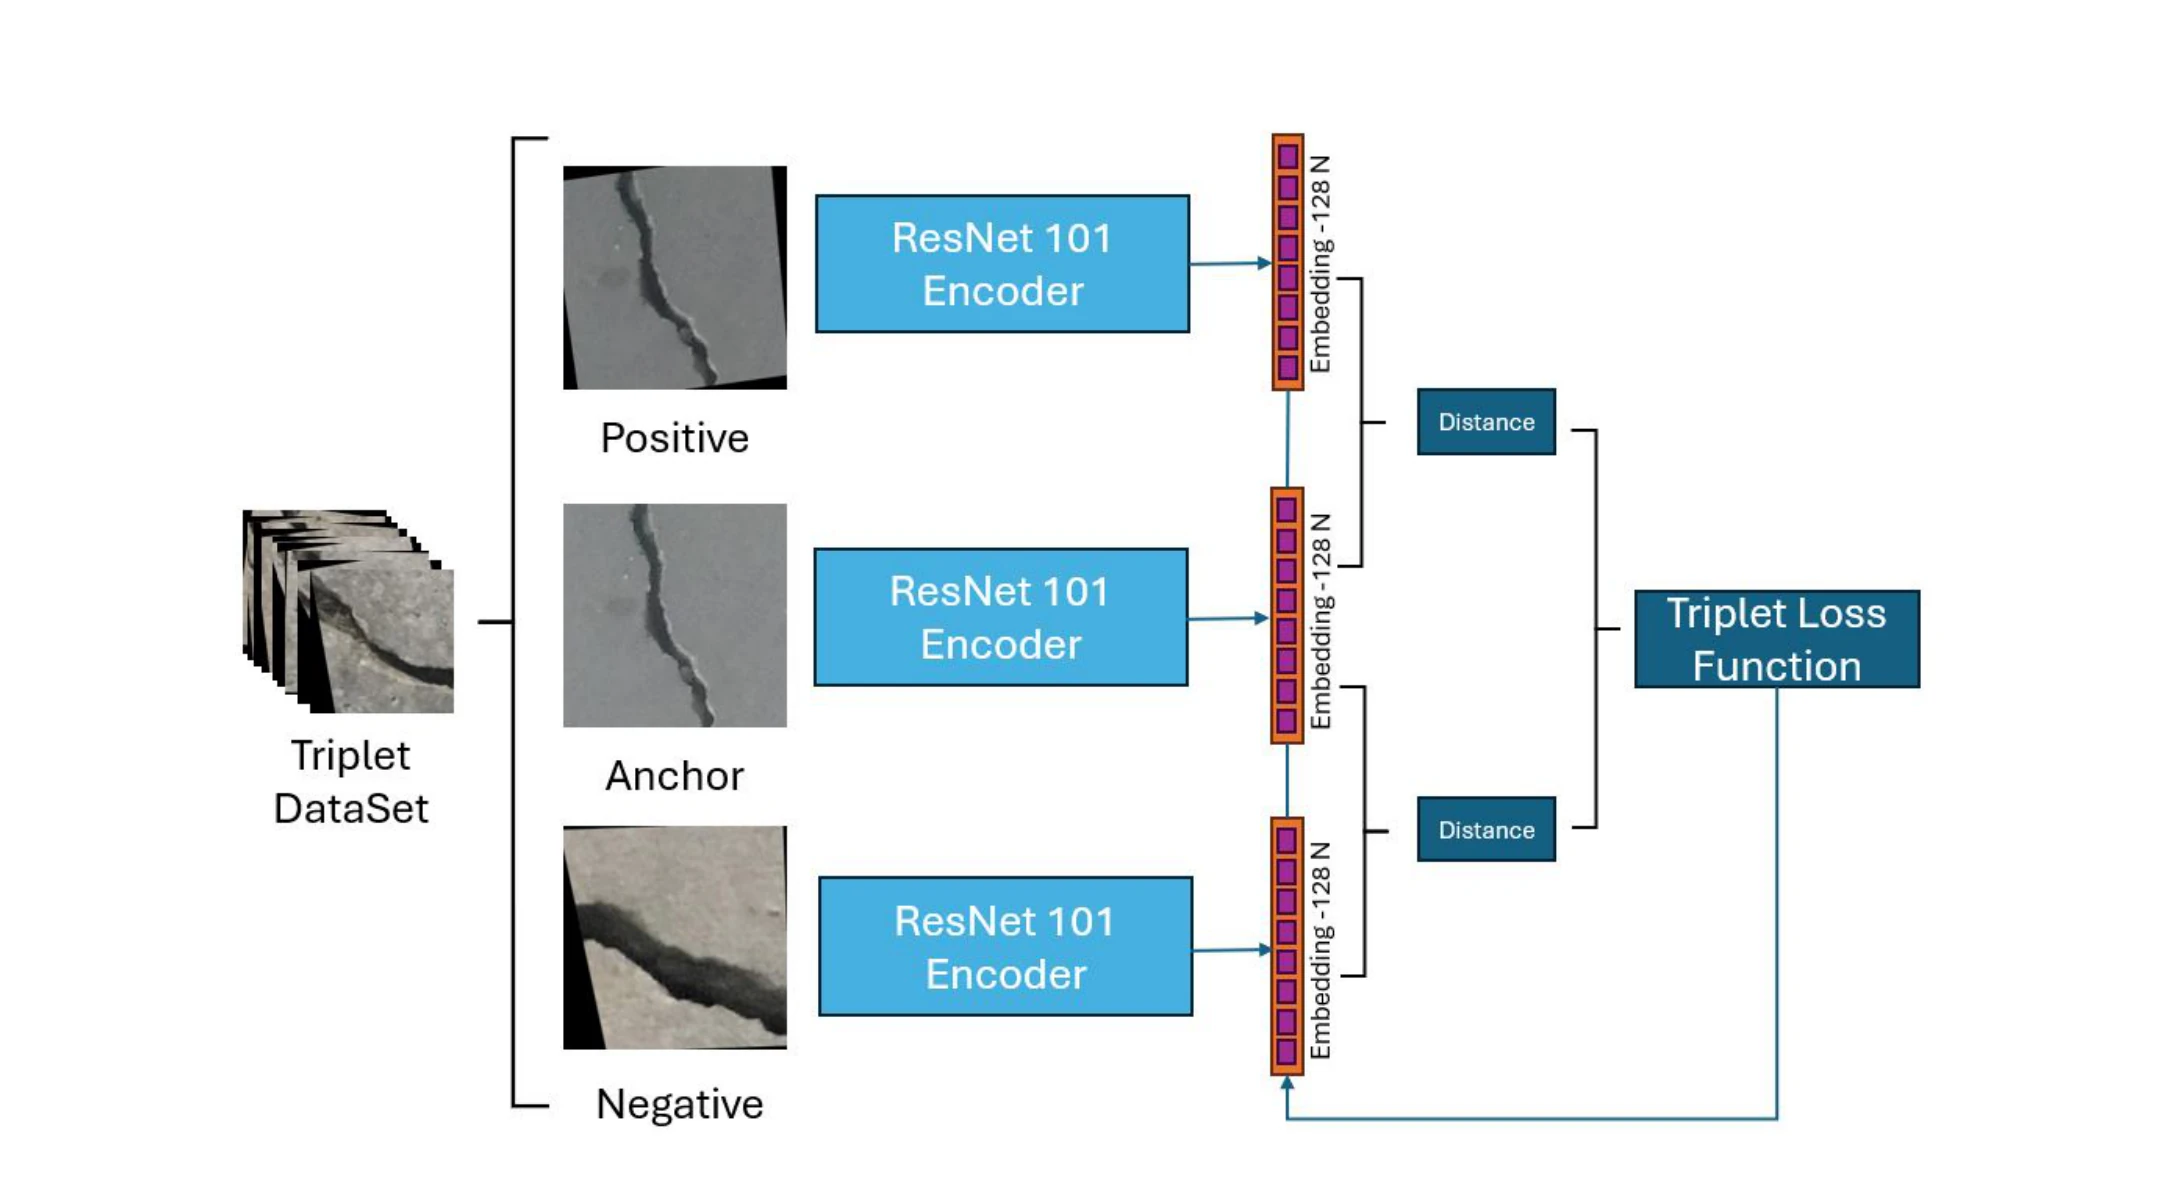
A shared ResNet-101 feature extractor and dense embedding head are trained with triplet loss. Manhattan distance and a reported threshold of 10.56 drive verification.
 Open figure —
Three shared encoders map anchor, positive and negative images into a 128-dimensional embedding space.
Triplet Loss-Based Concrete Crack Verification, Fig. 1, p. 2.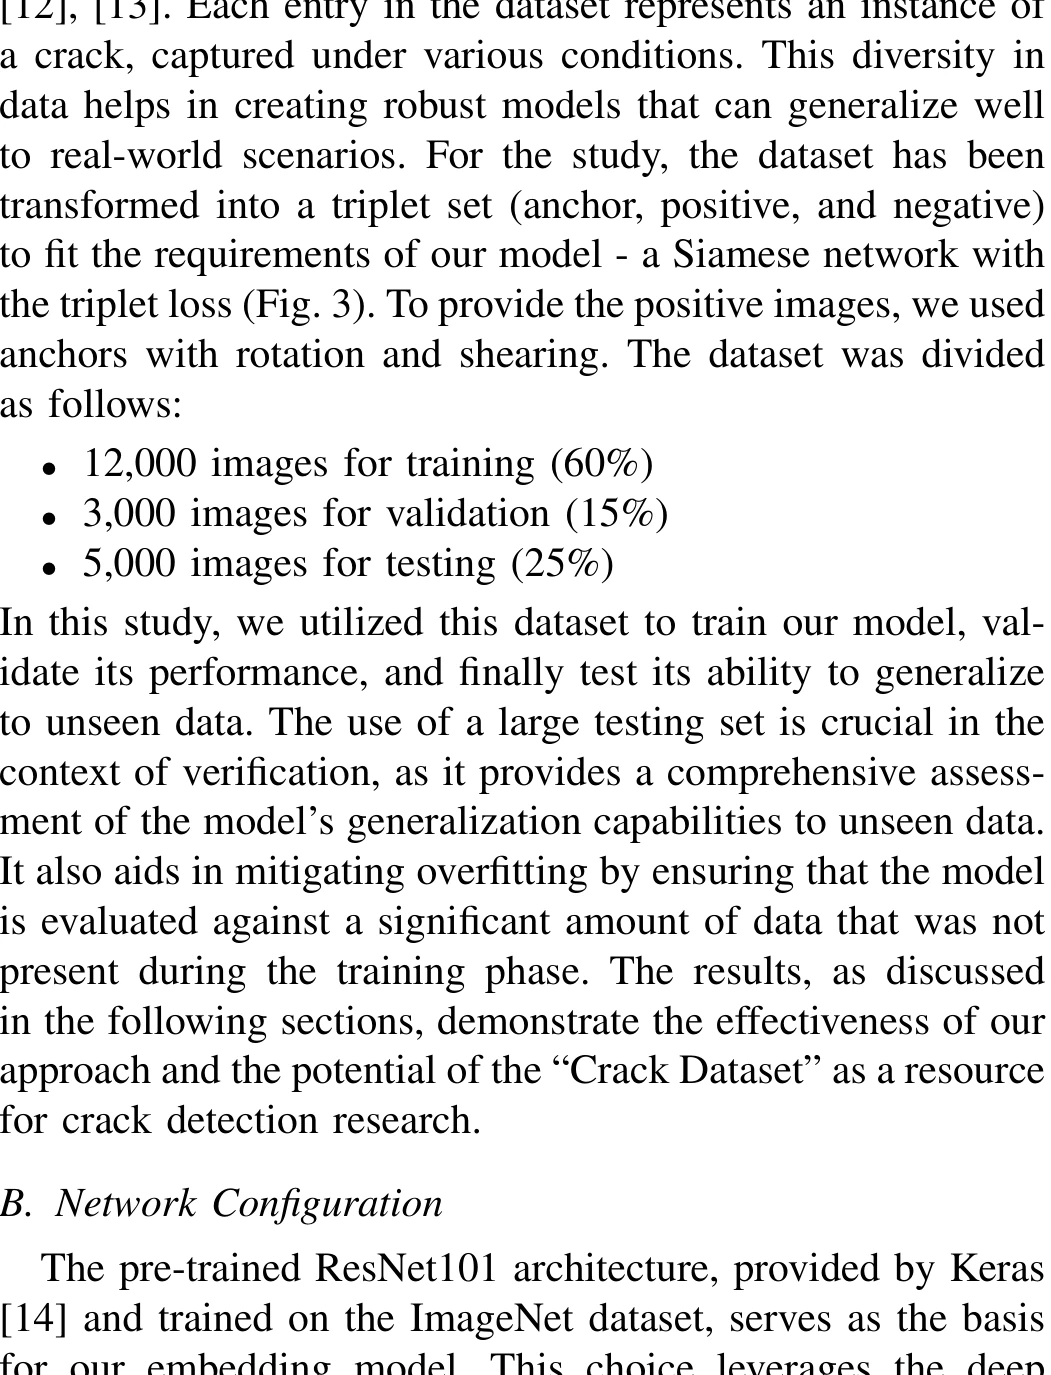 Open figure —
ResNet-101 backbone used by each branch of the shared encoder.
Triplet Loss-Based Concrete Crack Verification, Fig. 2, p. 3.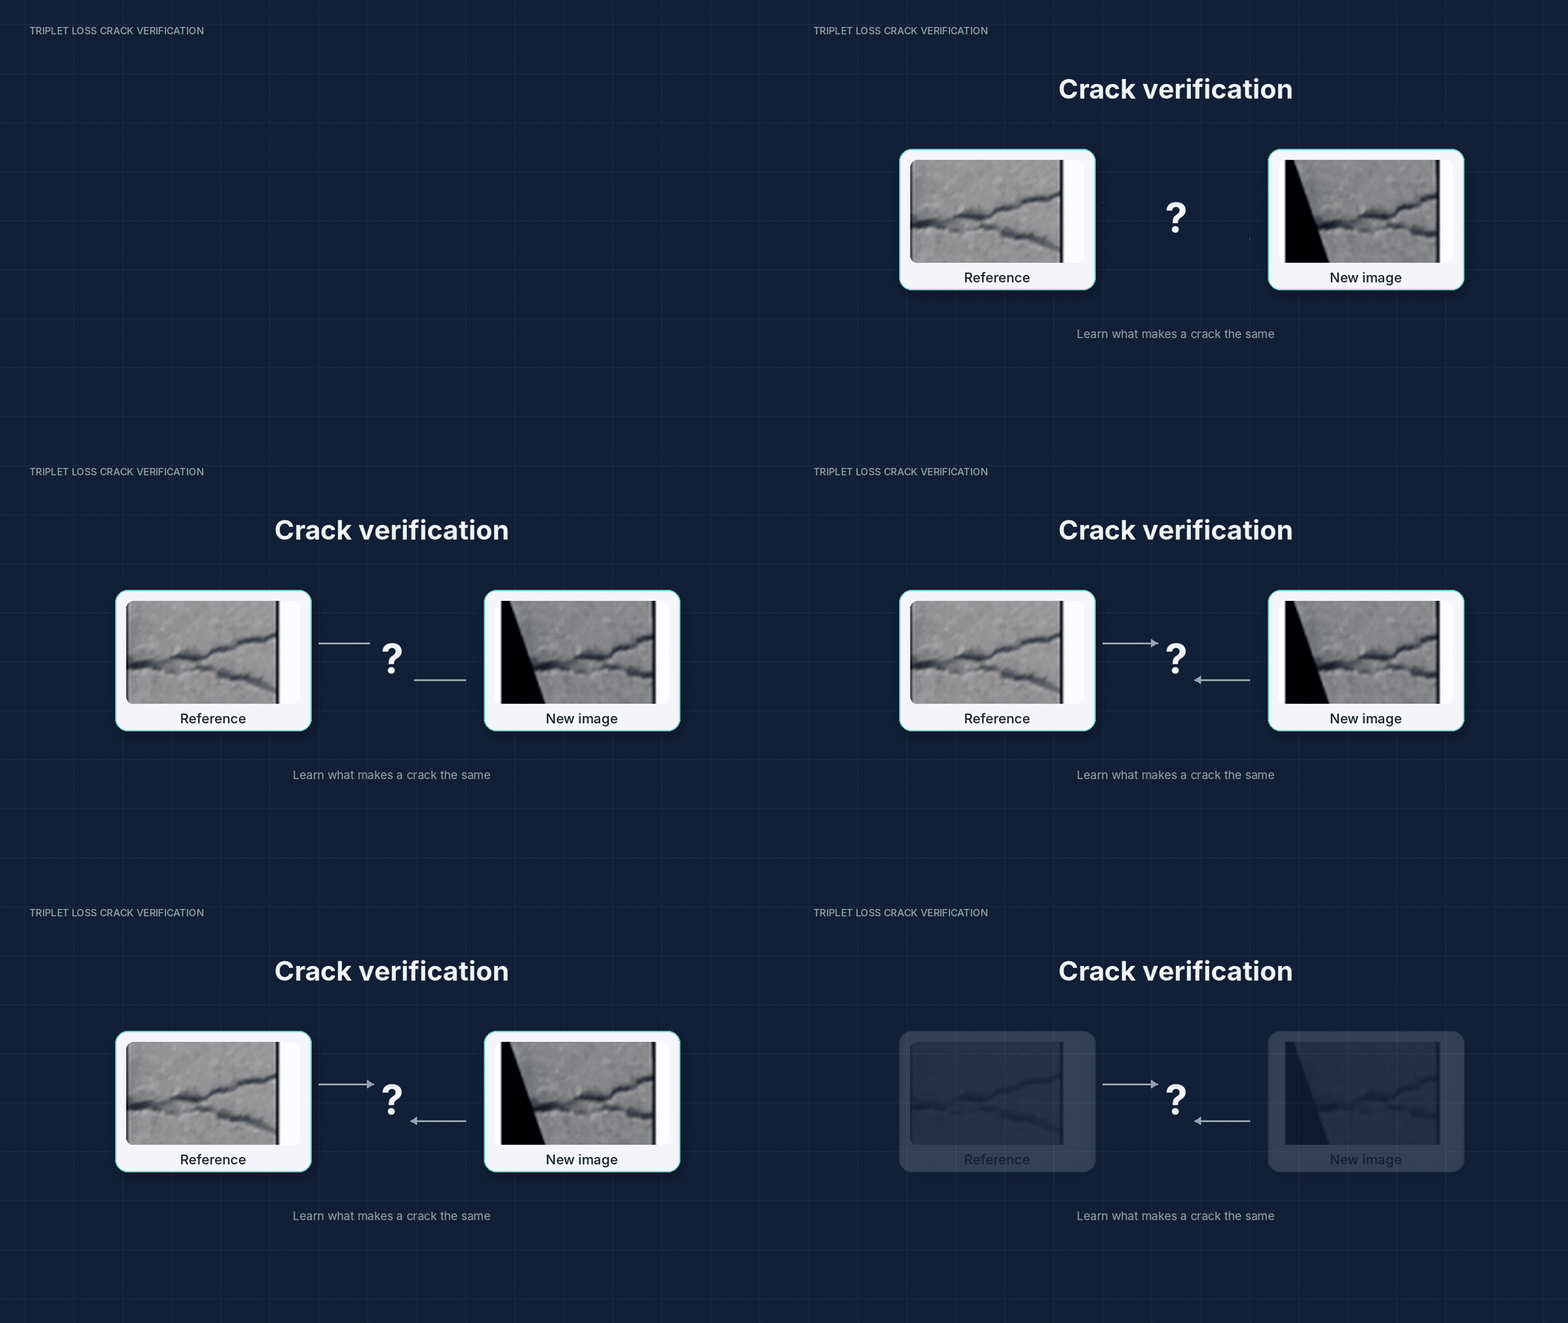 Open figure —
Illustrates the image-comparison task addressed by the verification model.
A8neyestani/triplet_crack_verification, assets/motion/02_verification.gif; MIT-licensed repository media.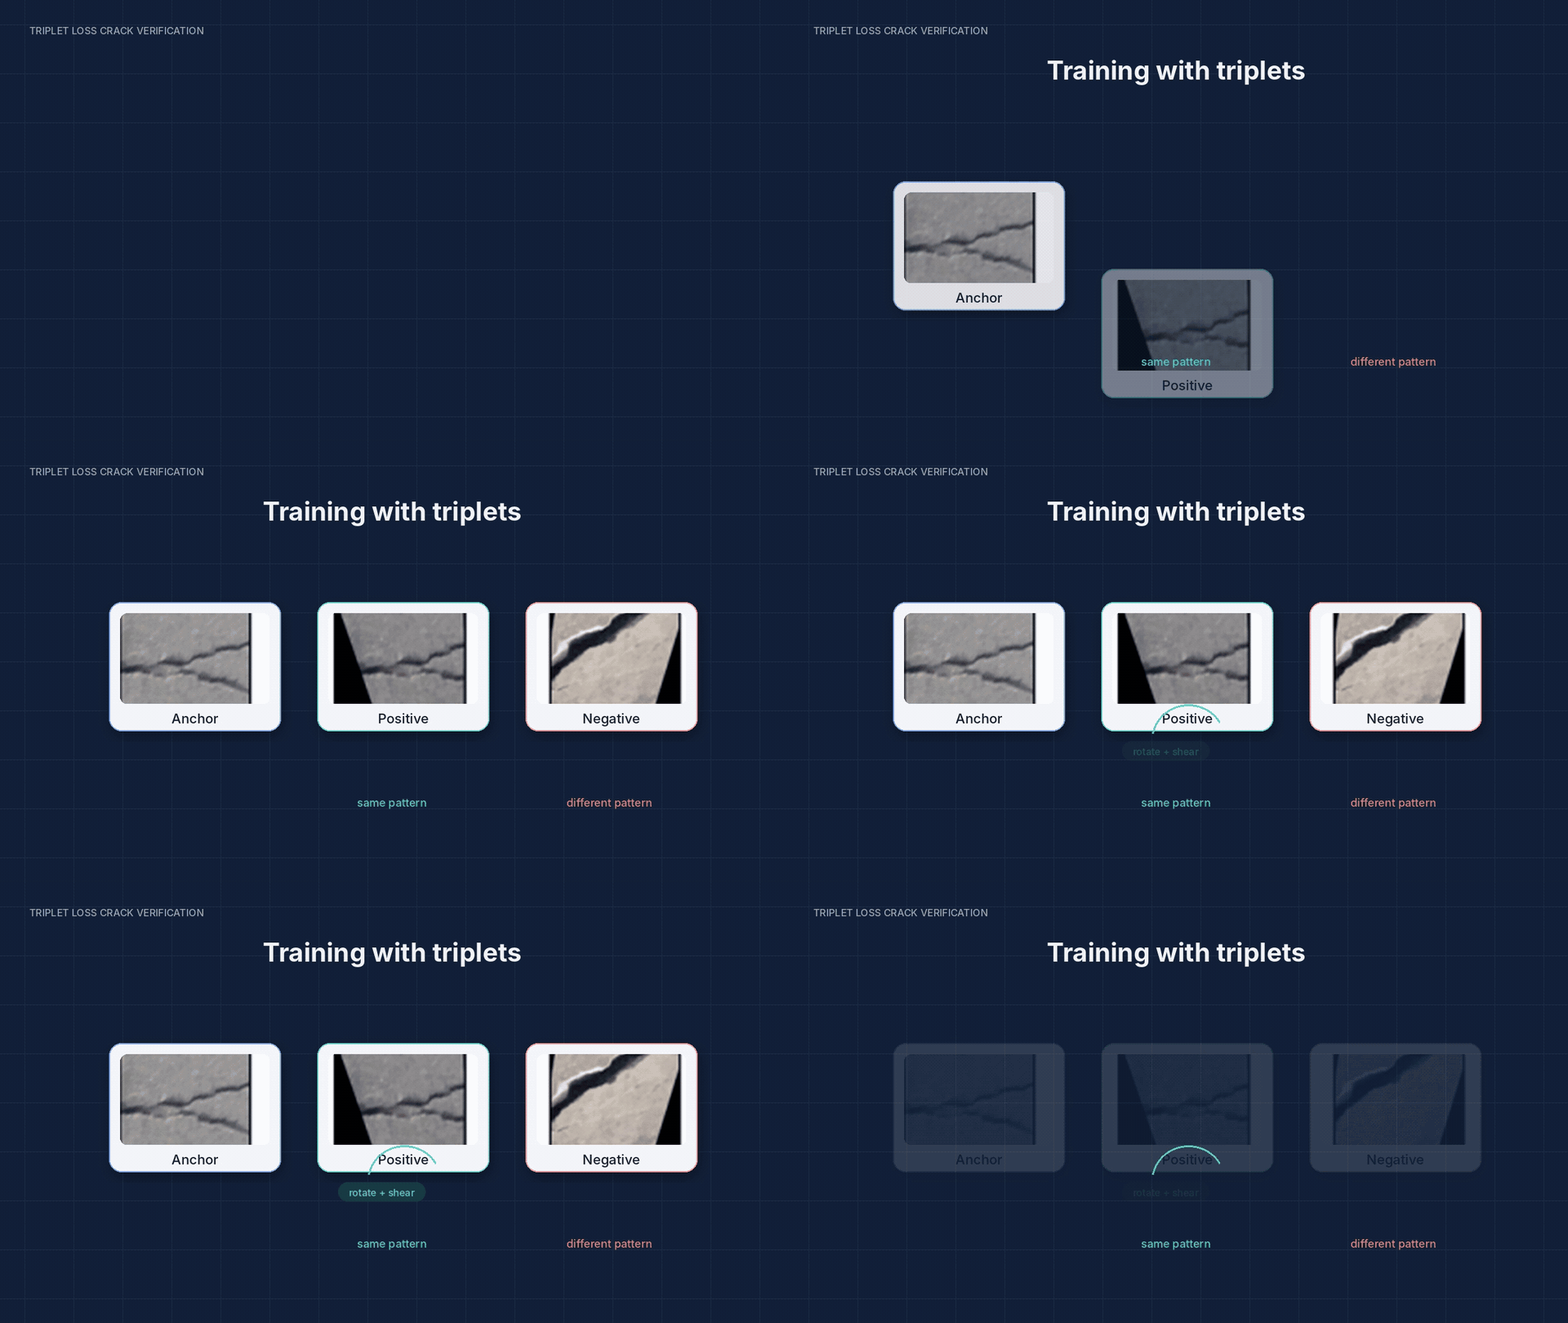 Open figure —
Shows how triplet loss brings anchor and positive embeddings closer while separating the negative embedding; an illustration, not an experimental result.
A8neyestani/triplet_crack_verification, assets/motion/03_triplet_training.gif; MIT-licensed repository media.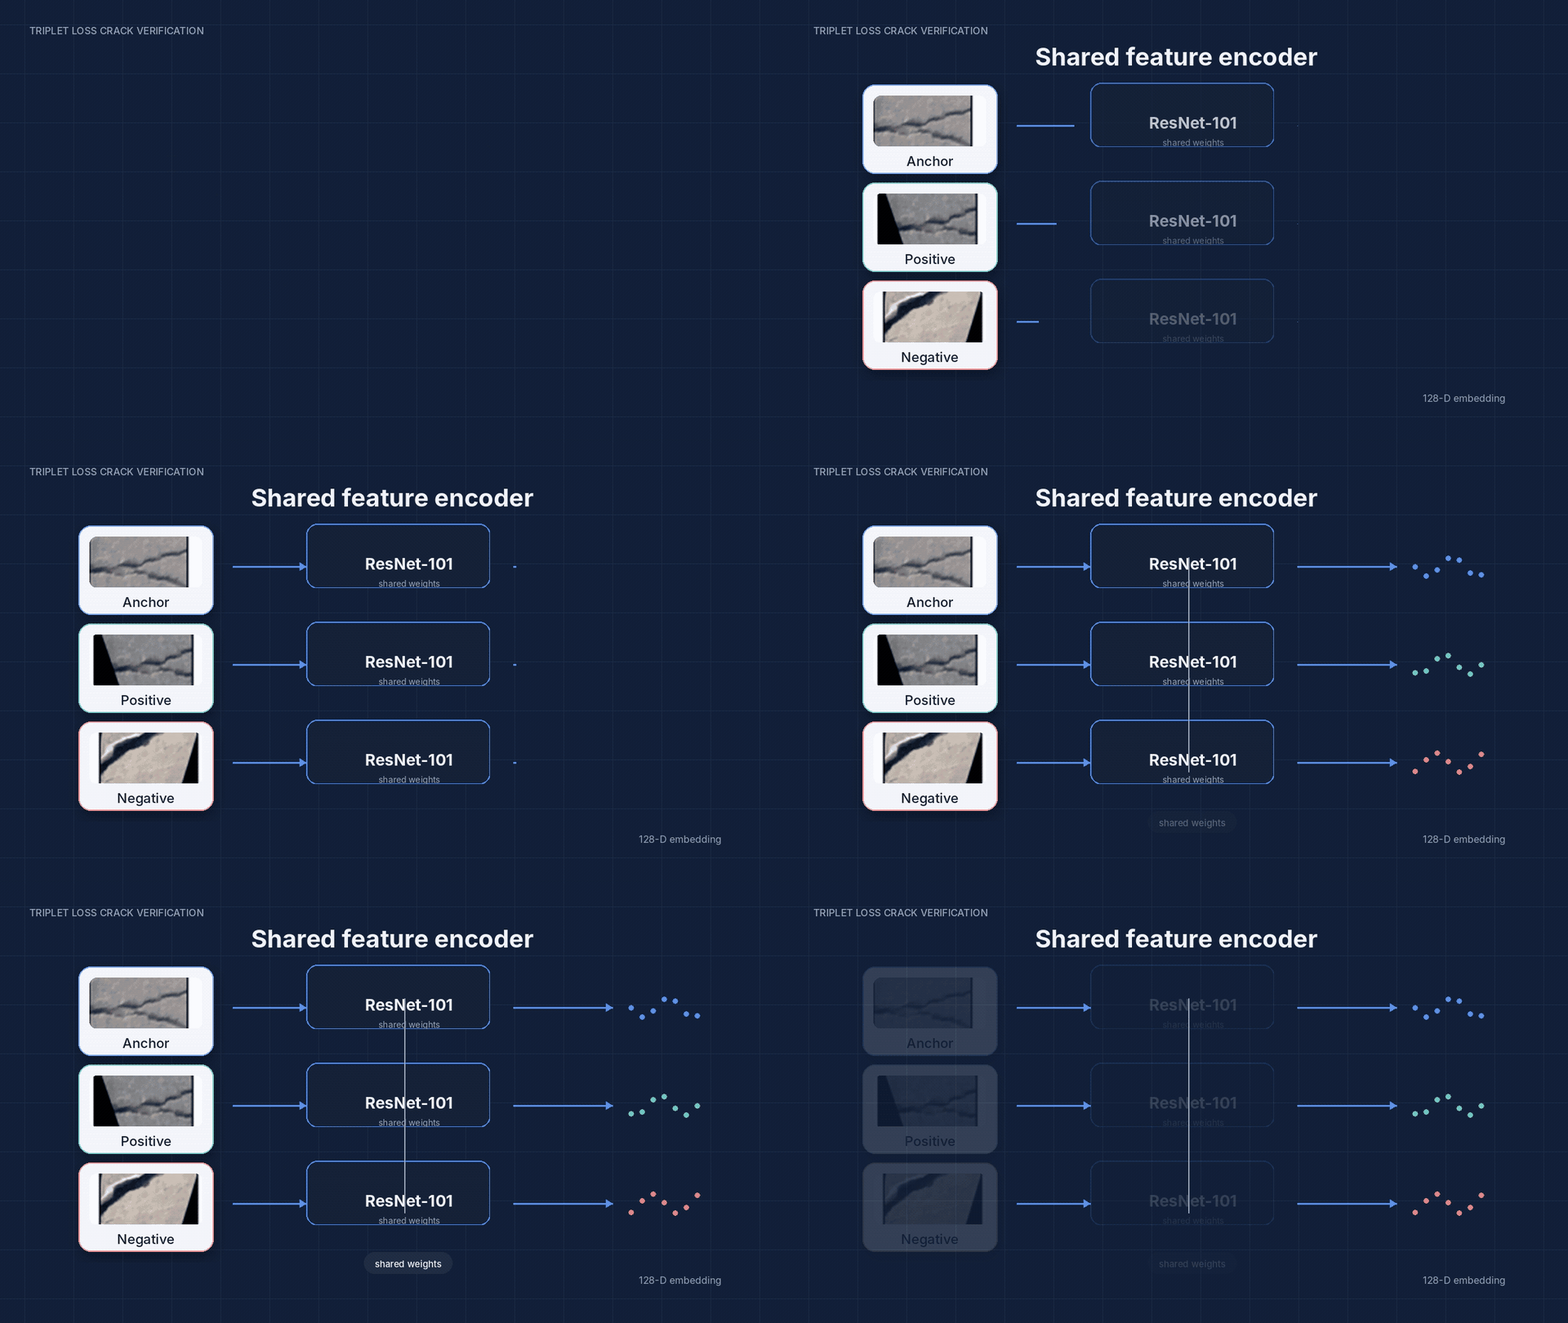 Open figure —
Shows the three triplet inputs processed by a shared encoder.
A8neyestani/triplet_crack_verification, assets/motion/04_shared_encoder.gif; MIT-licensed repository media.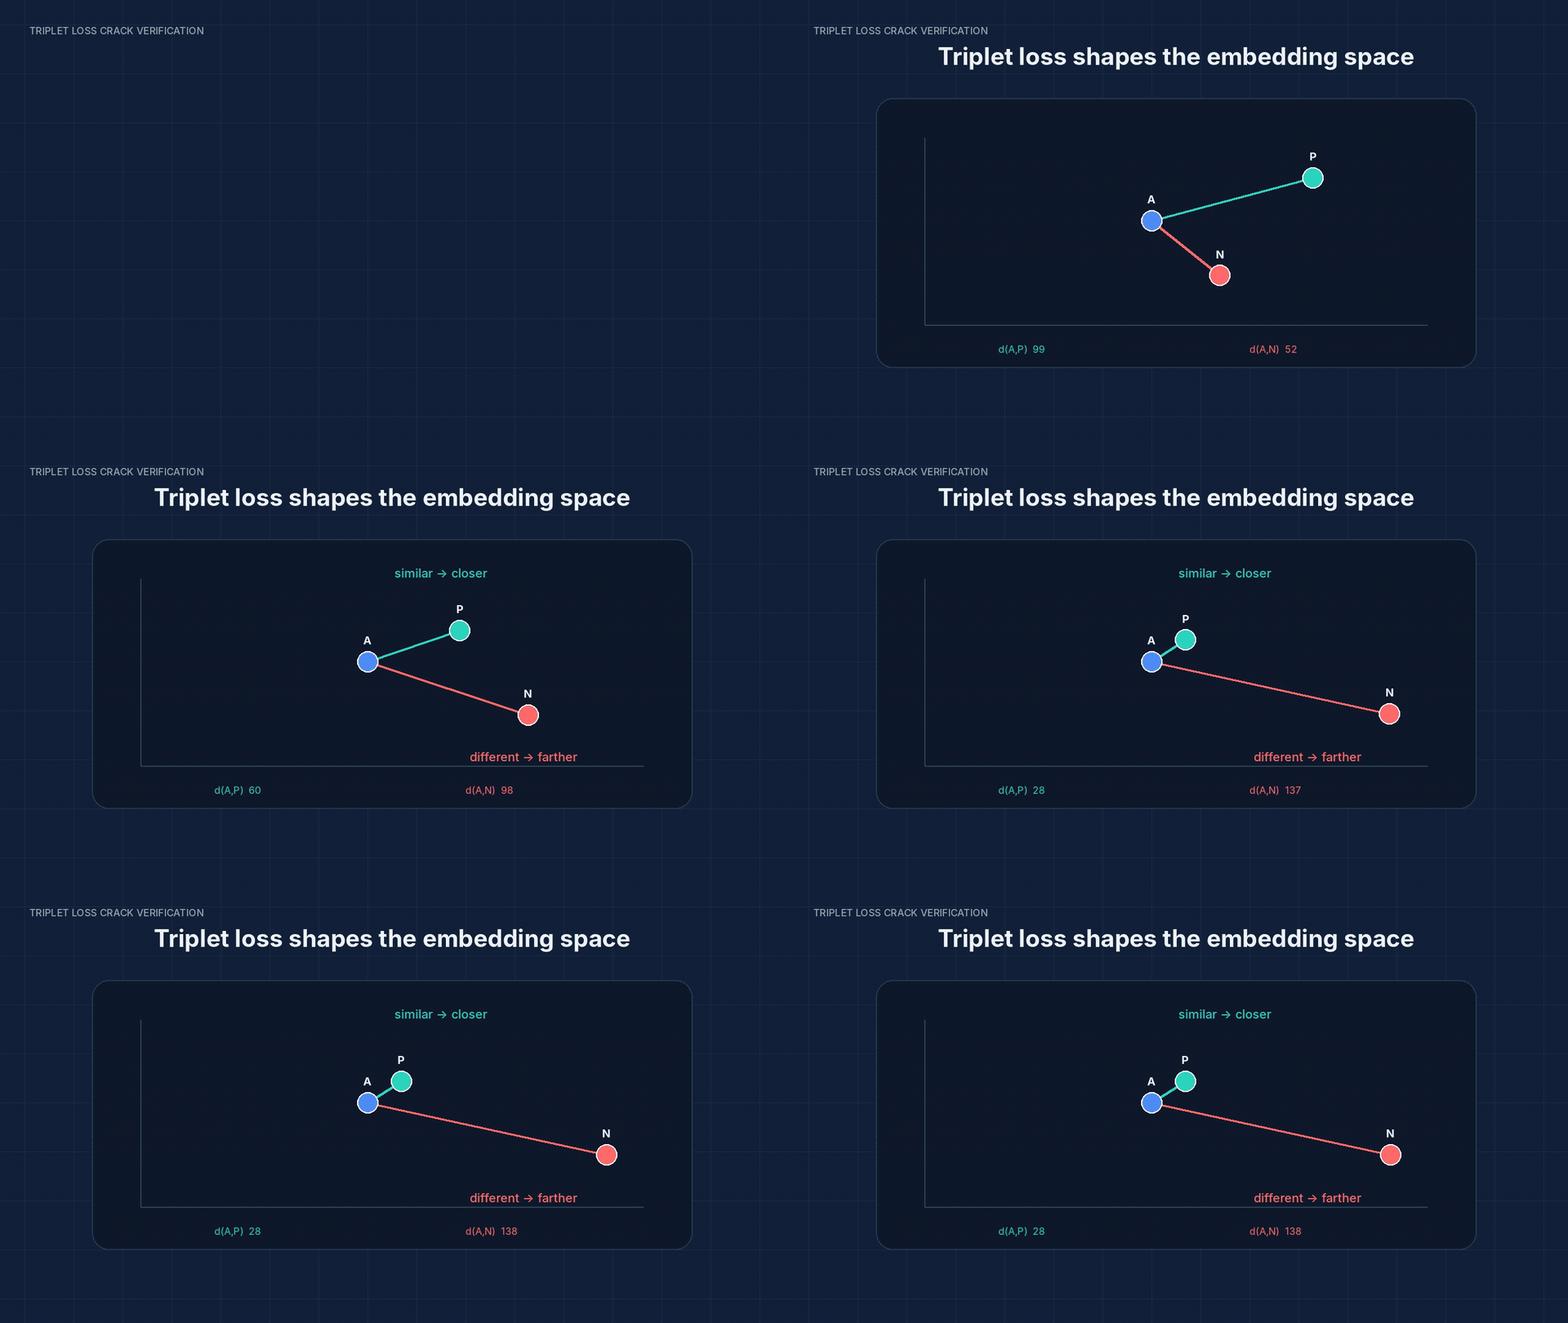 Open figure —
Visualizes the distance relationship that the triplet-loss objective is designed to shape.
A8neyestani/triplet_crack_verification, assets/motion/05_triplet_loss.gif; MIT-licensed repository media.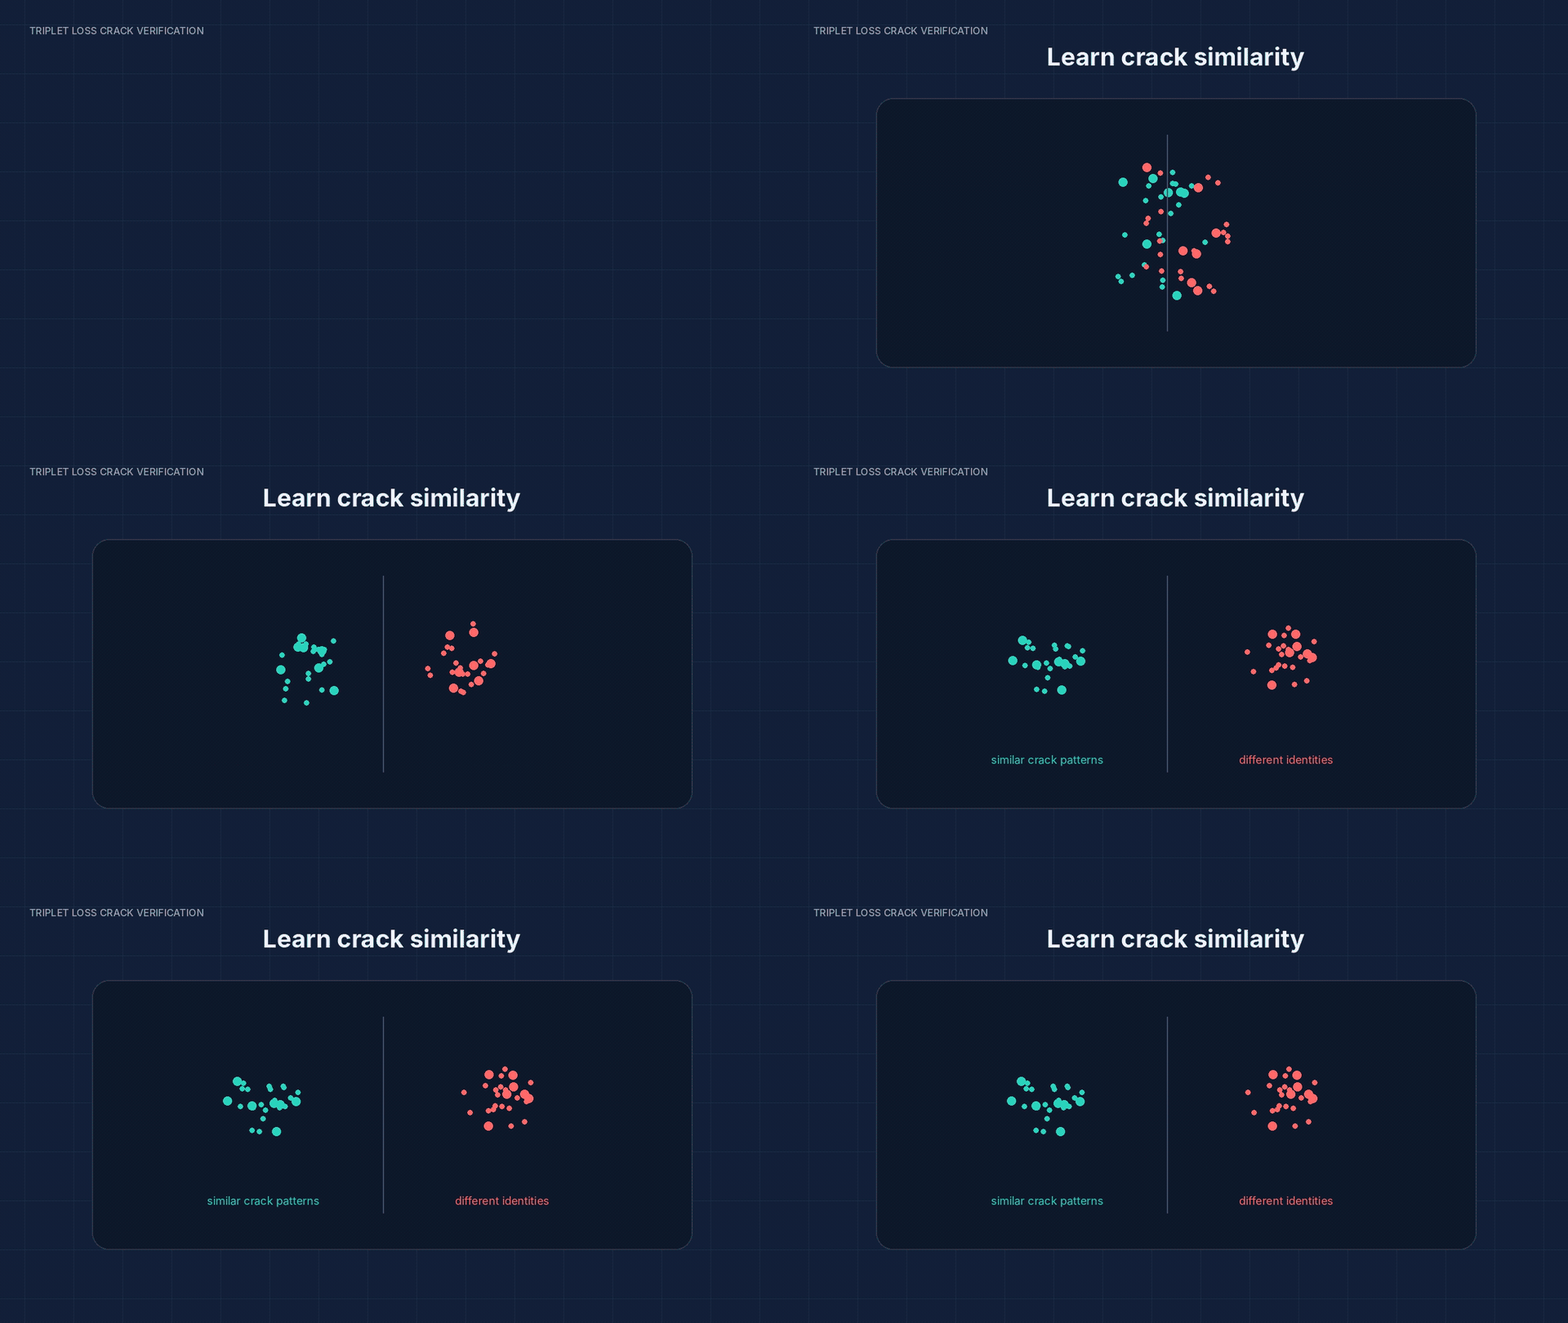 Open figure —
Illustrates similar patterns moving closer and different patterns farther apart in the learned embedding space.
A8neyestani/triplet_crack_verification, assets/motion/06_embedding_space.gif; MIT-licensed repository media.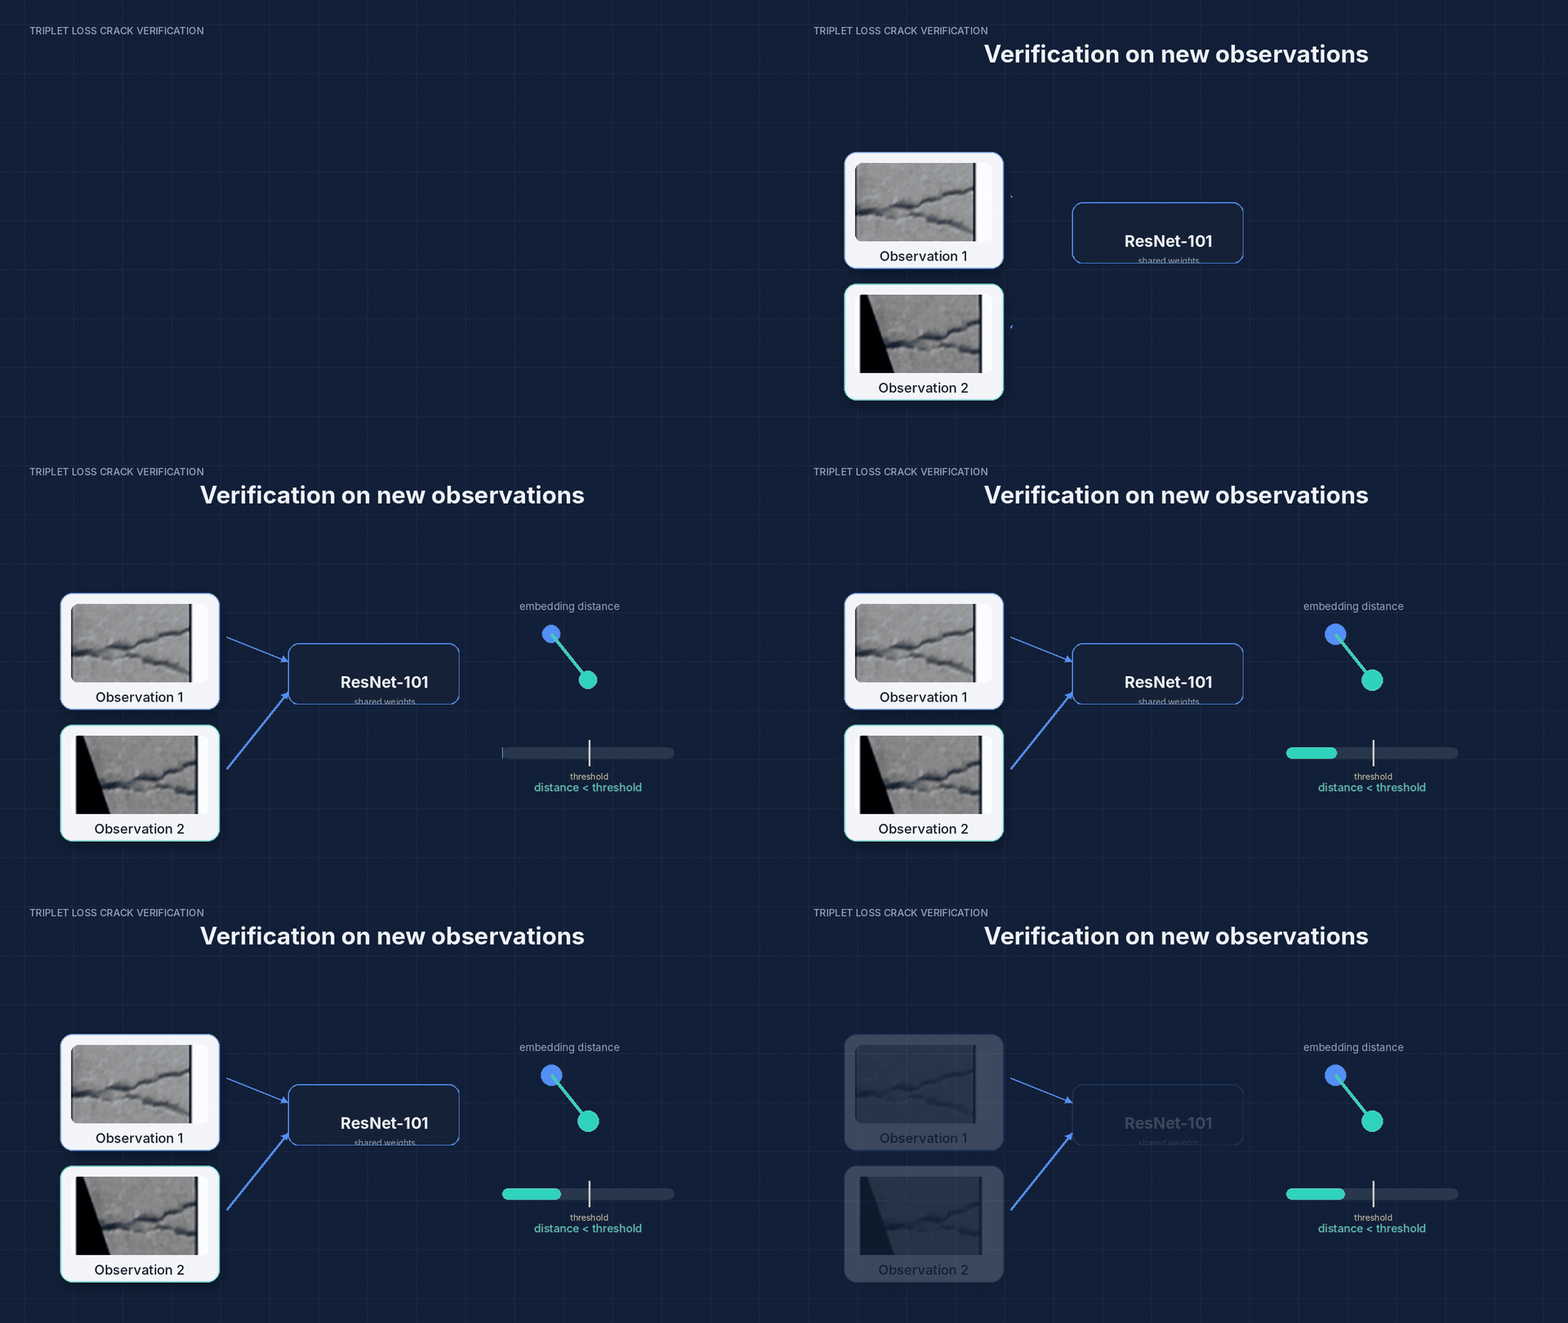 Open figure —
Shows the inference concept: encode two images and compare their embedding distance with a decision threshold.
A8neyestani/triplet_crack_verification, assets/motion/07_inference.gif; MIT-licensed repository media. Open figure —
Repository summary of the image-verification workflow.
A8neyestani/triplet_crack_verification, assets/motion/10_summary.gif; MIT-licensed repository media.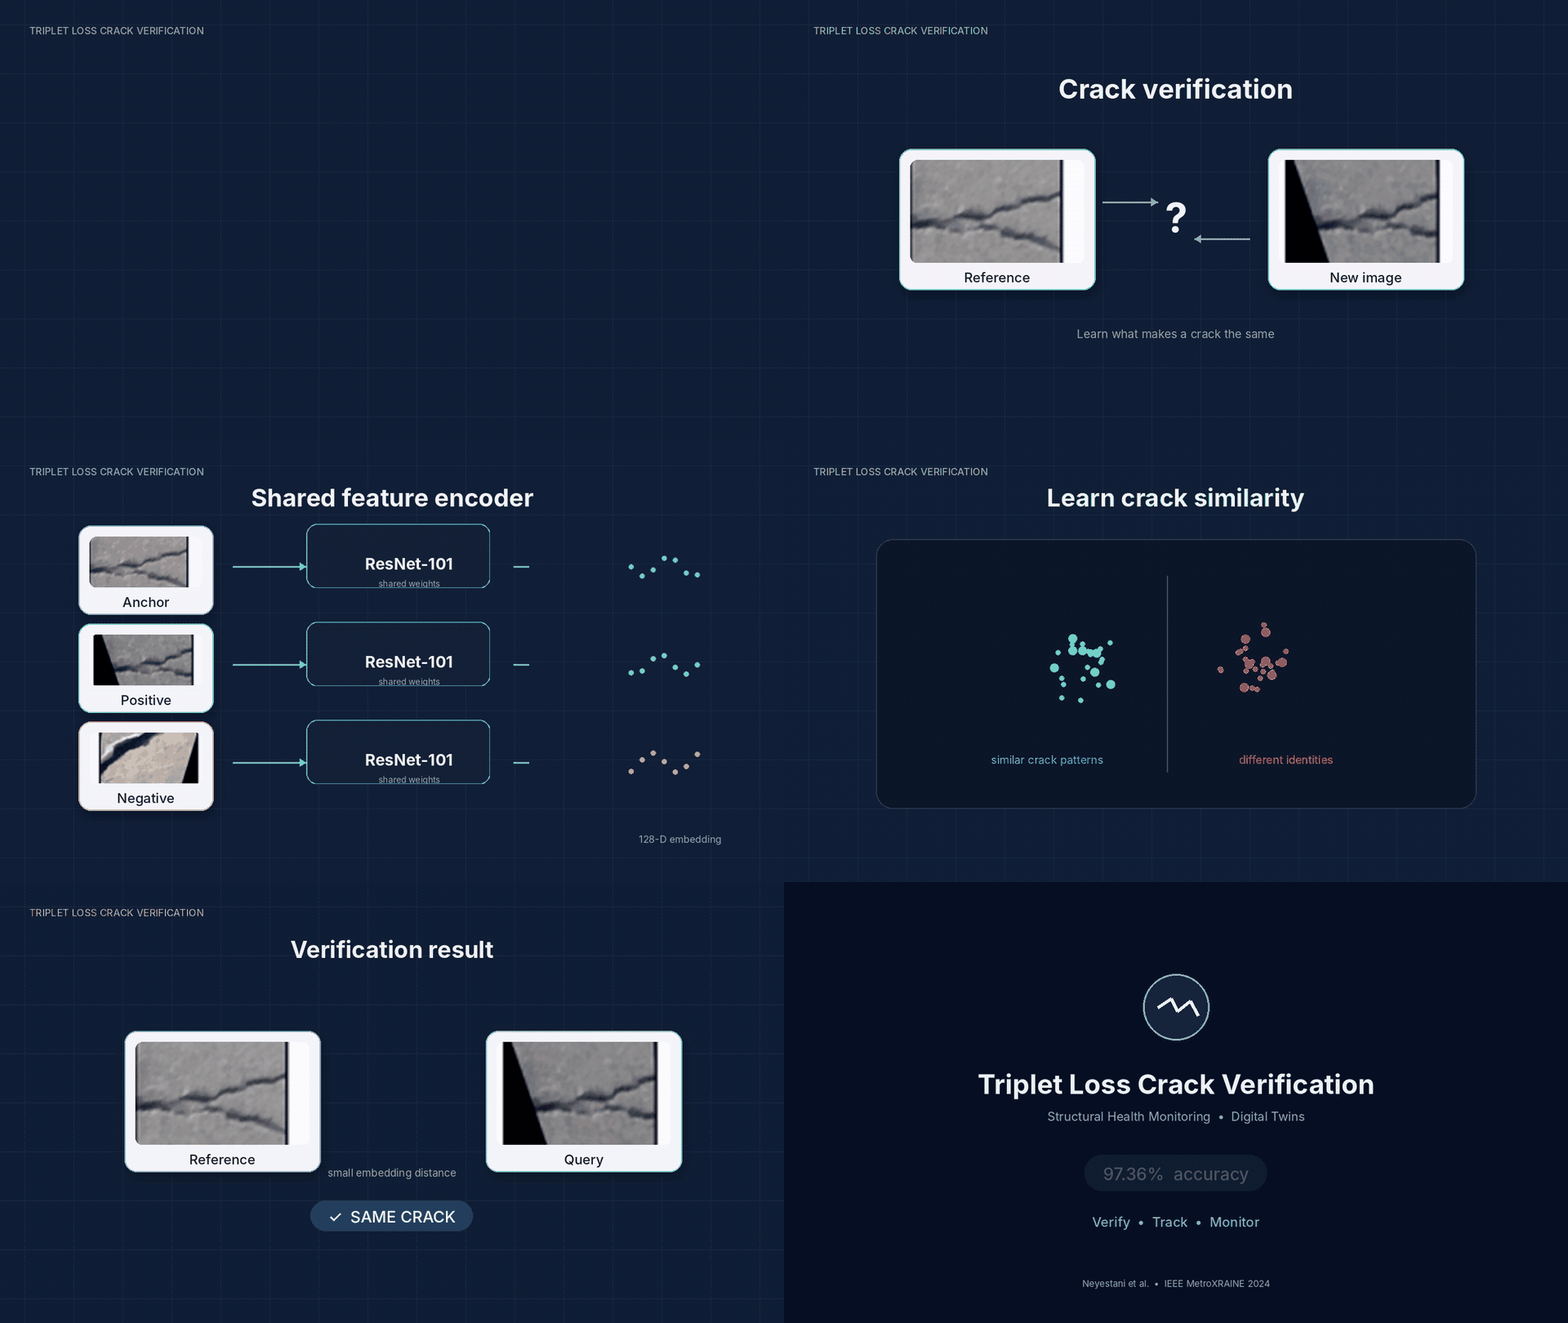 Open figure —
Full repository walkthrough of the triplet-loss verification method.
A8neyestani/triplet_crack_verification, assets/motion/full_methodology.gif; MIT-licensed repository media.Results
Reported results
accuracy
prepared image-pair benchmark
precision
prepared image-pair benchmark
AUC
prepared image-pair benchmark
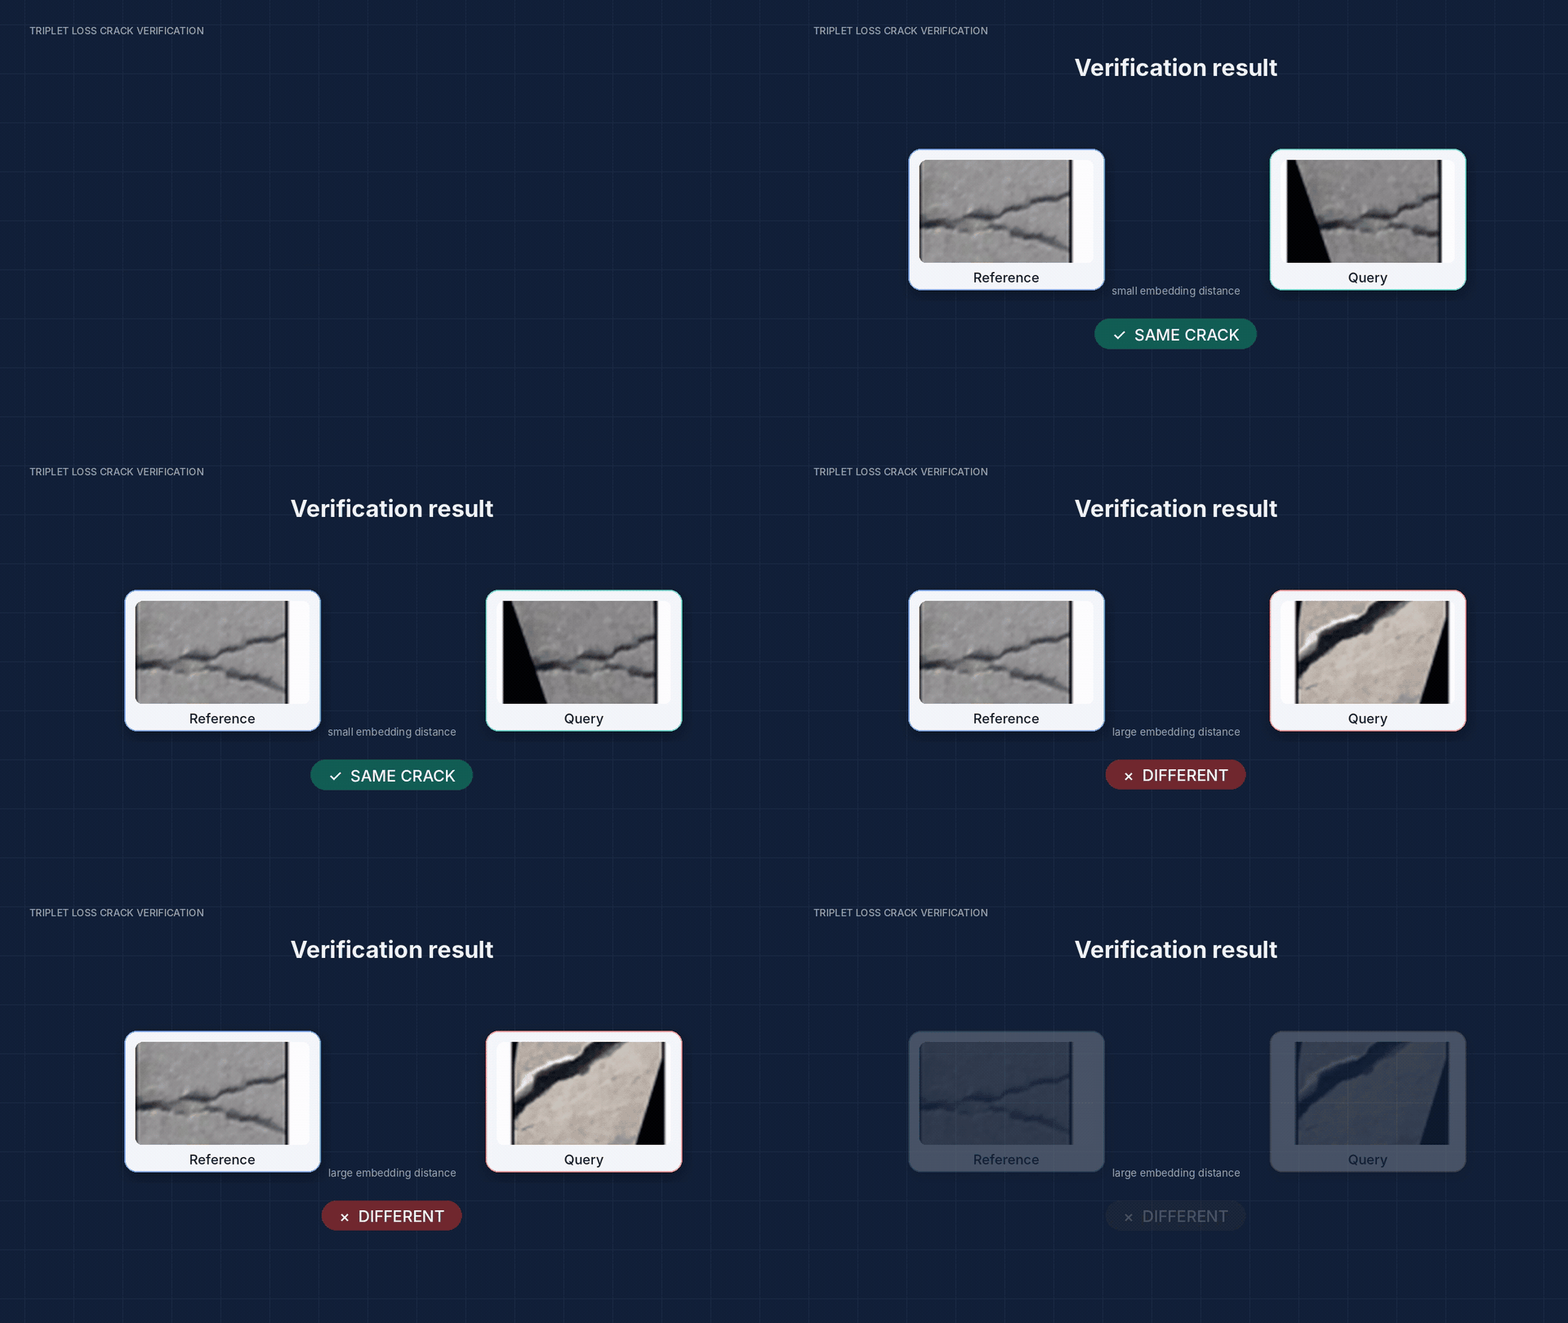 Open figure —
Repository result visualization; the reported benchmark evaluates prepared image pairs, not longitudinal field observations.
A8neyestani/triplet_crack_verification, assets/motion/08_verification_result.gif; MIT-licensed repository media.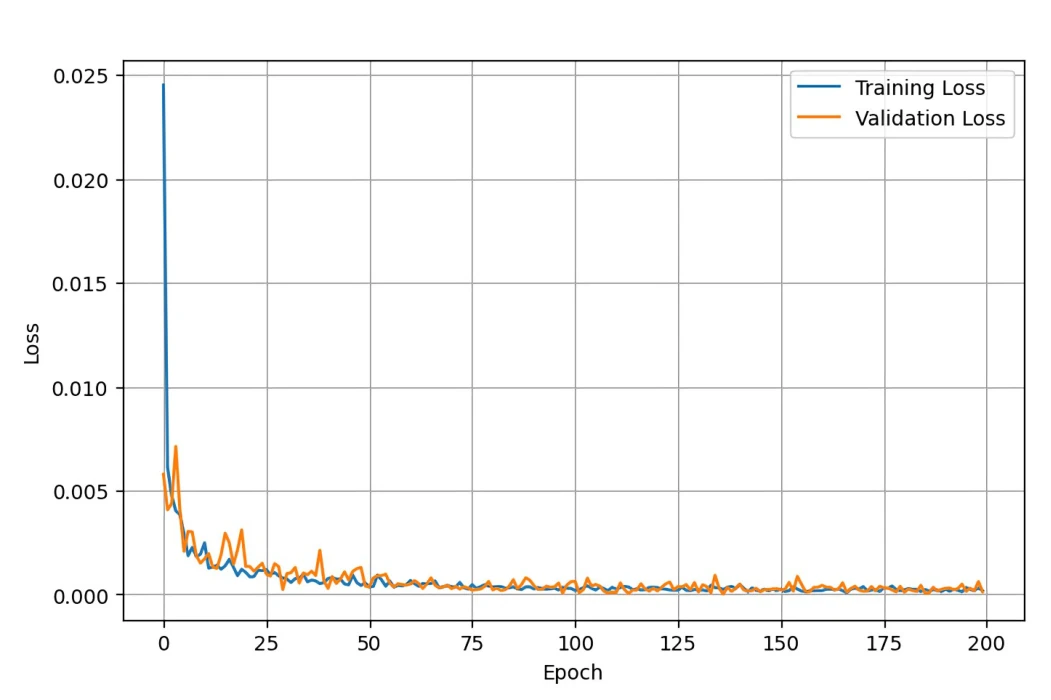 Open figure —
Model loss during training.
Triplet Loss-Based Concrete Crack Verification, Fig. 4, p. 4.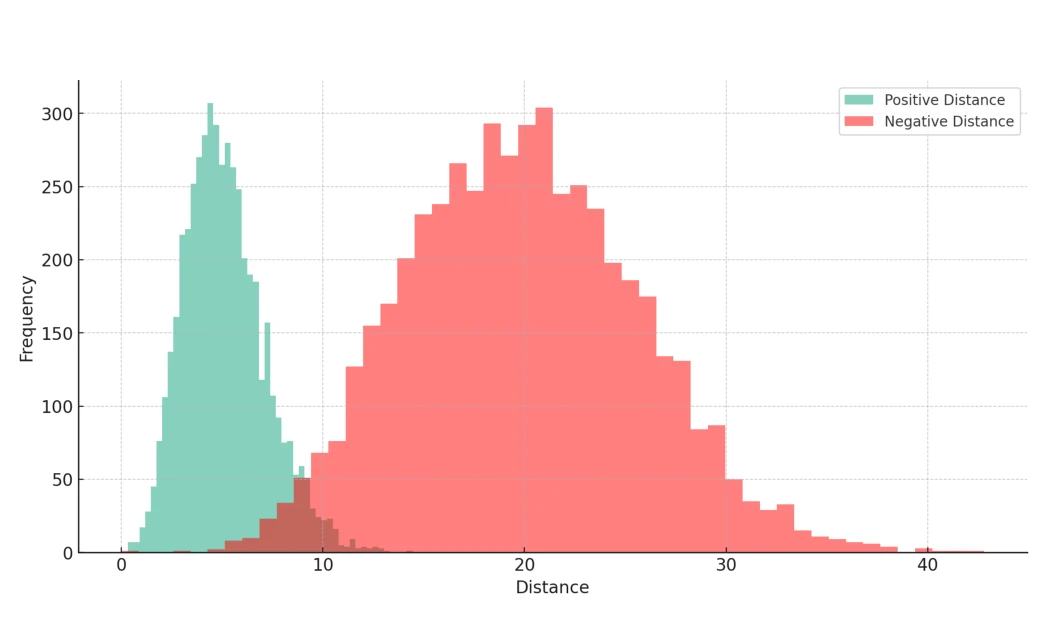 Open figure —
Distance distributions show the separation and remaining overlap between prepared positive and negative pairs.
Triplet Loss-Based Concrete Crack Verification, Fig. 5, p. 5.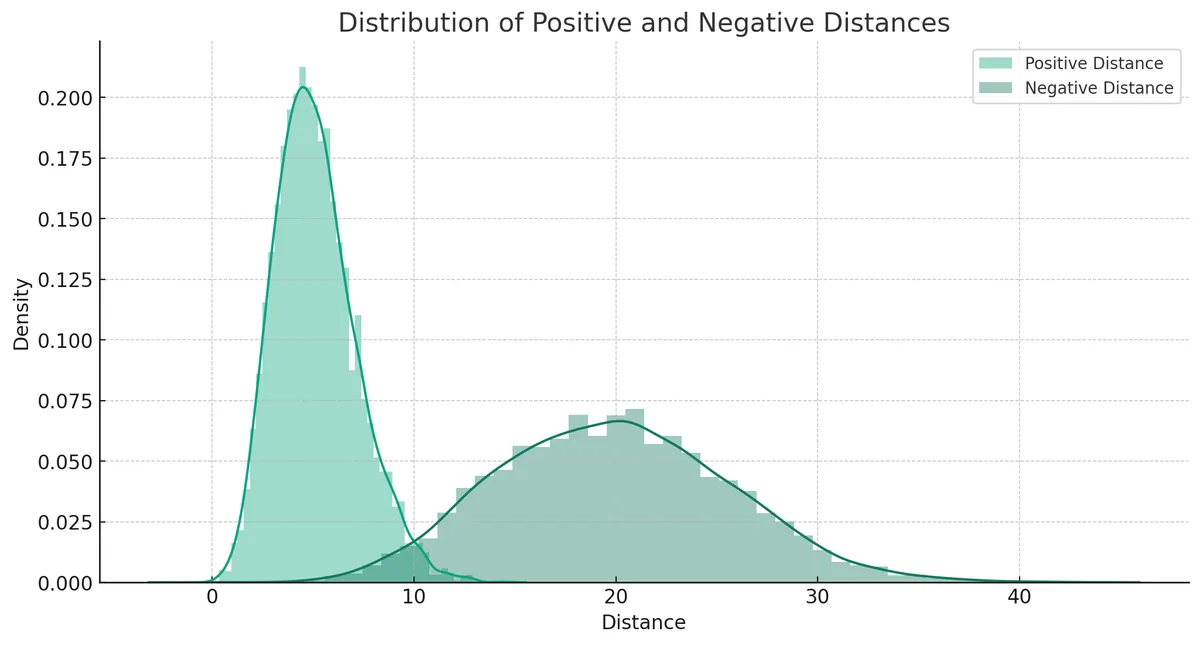
Validation & uncertainty
Reference and uncertainty checks
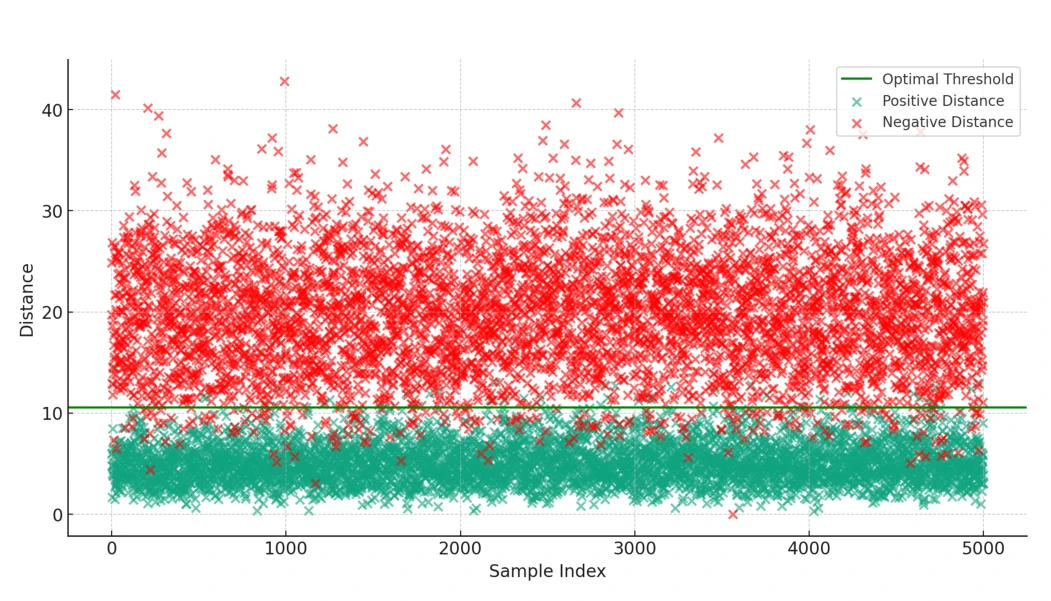
Released distance outputs show the separation between prepared positive and negative pairs. Accuracy, precision, and AUC are tied to that benchmark construction.
 Open figure —
Individual pair distances and the selected decision threshold.
Triplet Loss-Based Concrete Crack Verification, Fig. 6, p. 5.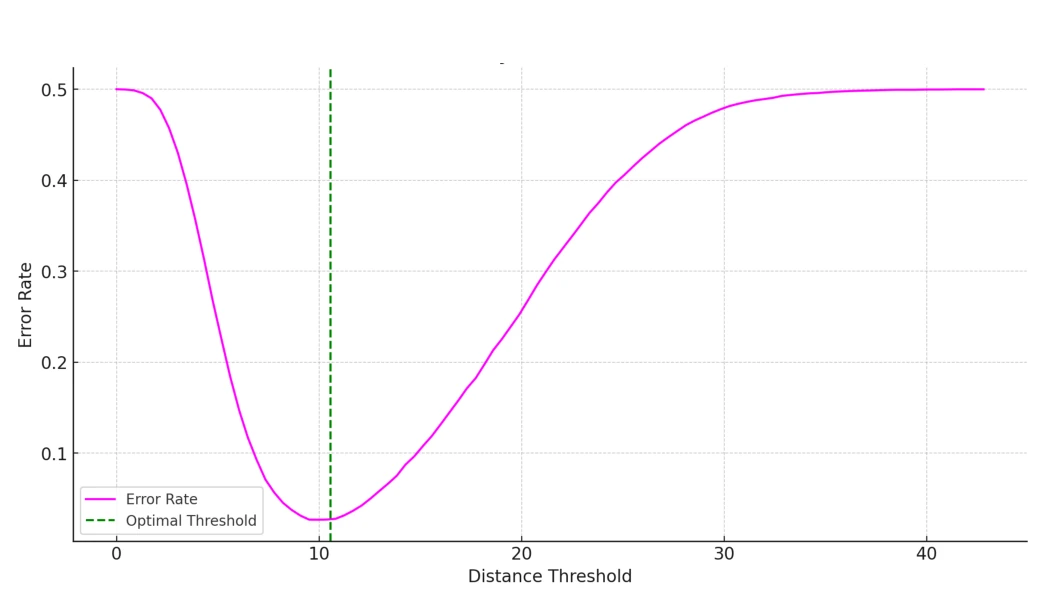 Open figure —
Classification error as the embedding-distance threshold changes.
Triplet Loss-Based Concrete Crack Verification, Fig. 7, p. 5.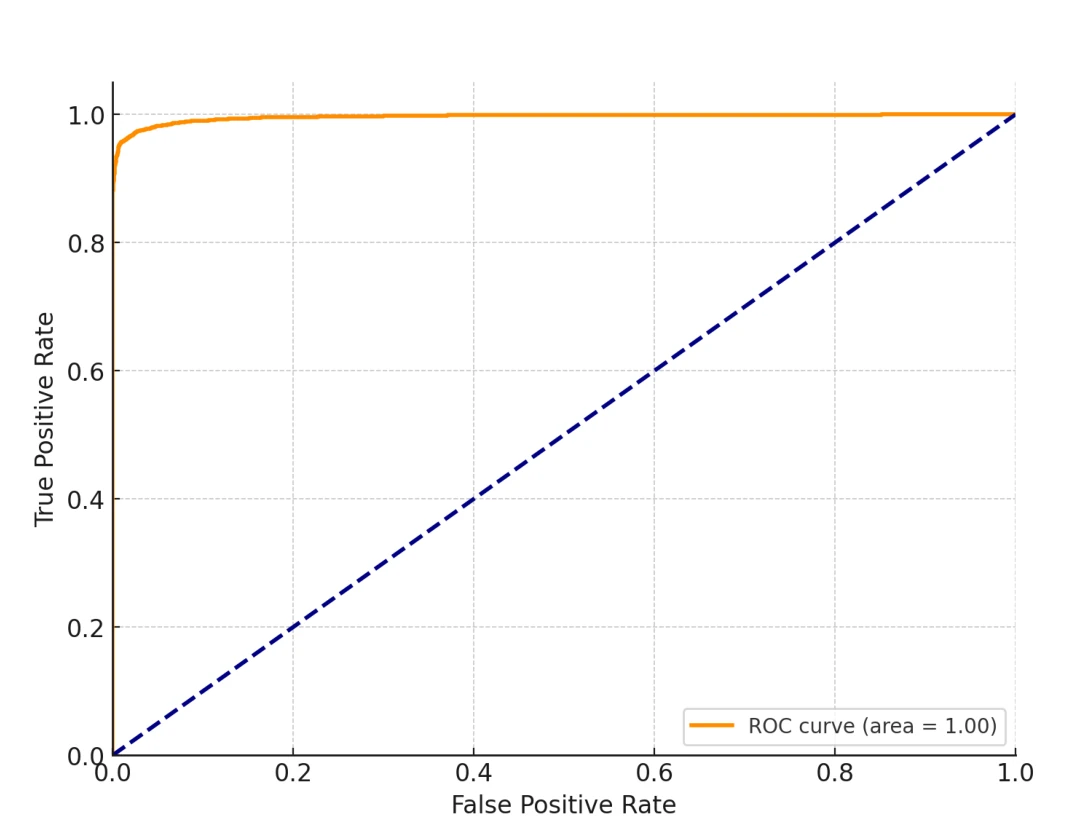 Open figure —
ROC curve across verification thresholds.
Triplet Loss-Based Concrete Crack Verification, Fig. 8, p. 6.Limitations & failure modes
Operating limits and failure modes
 Open figure —
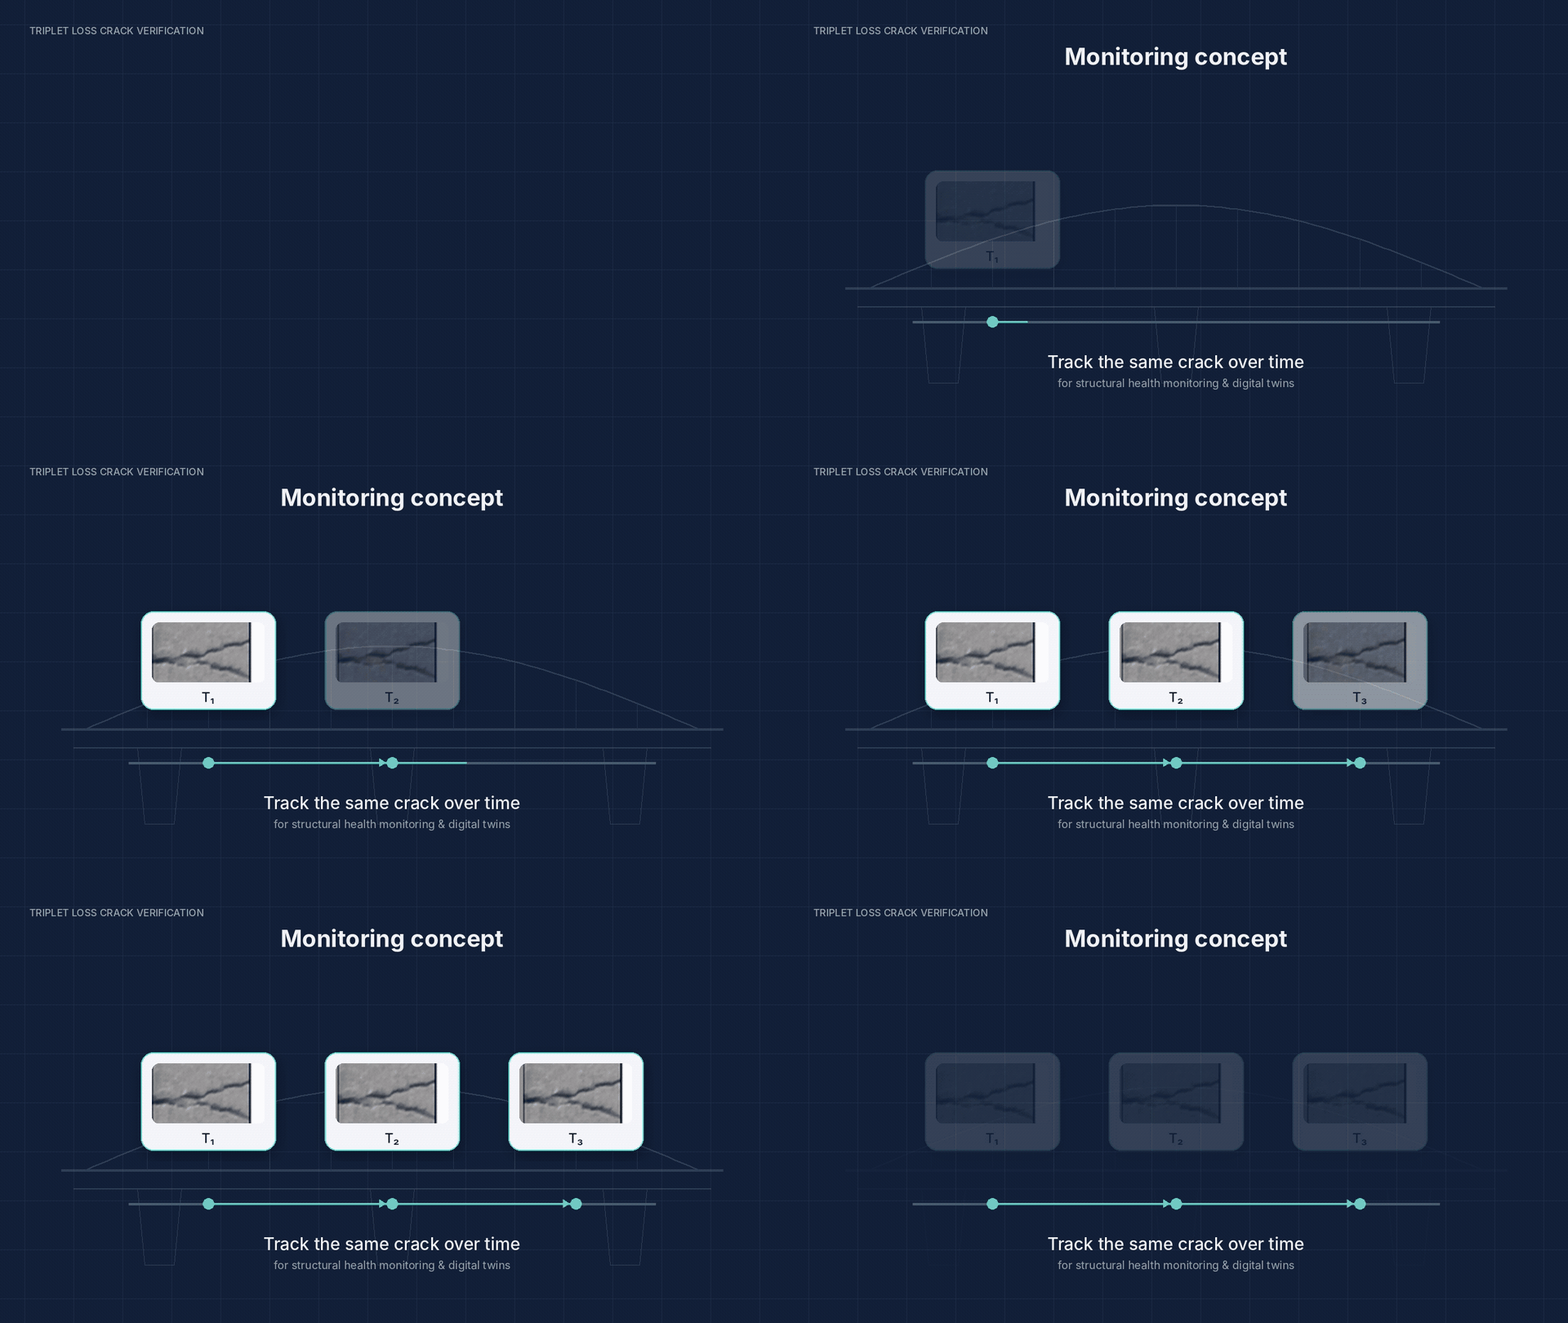
Proposed monitoring concept from the repository walkthrough; longitudinal crack tracking was not validated in the reported experiment.
A8neyestani/triplet_crack_verification, assets/motion/09_monitoring.gif; MIT-licensed repository media.Large appearance change, unseen surface texture, severe occlusion, repeated crack morphology, and domain shift can move embeddings across the verification threshold.
The positive examples were generated by rotation and shearing, not captured as repeated observations of the same physical crack. These results do not validate longitudinal field tracking or a deployed digital twin.
Technical stack
Tools selected for the measurement chain
- Python
- TensorFlow
- ResNet-101
- Metric learning
- Triplet loss
- Evaluation tooling
Sources & project links
Papers and code
IEEE MetroXRAINE 2024 paper and MIT-licensed public repository. The distance chart is a repository output generated from released evaluation data.