
Problem
What needed to be understood or measured
A trajectory can look plausible while concealing how image disparity, camera geometry, feature selection, attitude, and altitude measurements affect the reliability of each estimated position.
My contribution
My contribution
I contributed to the computer-vision methodology and experiments as a co-author. The papers do not specify a finer per-author task split.
Experimental setup
Data and setup
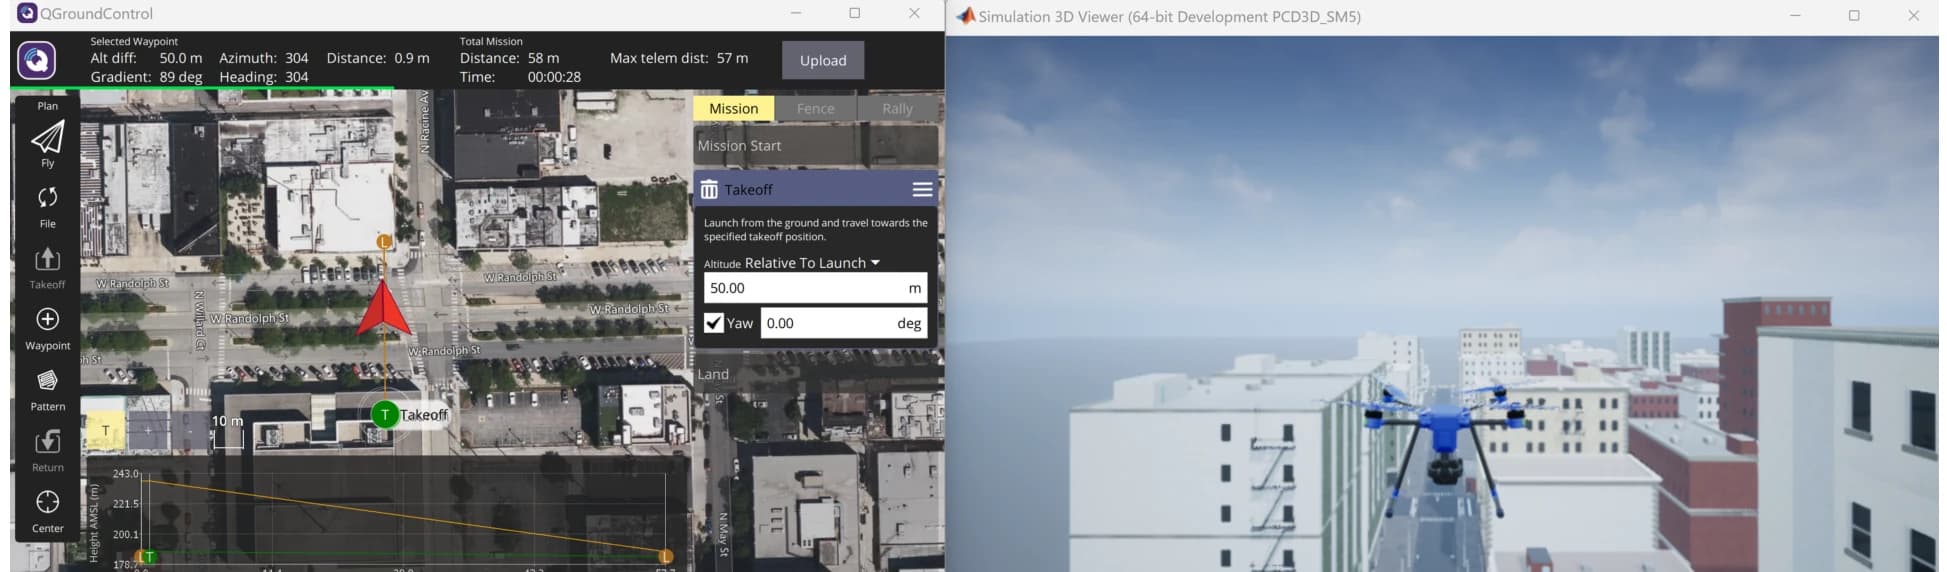
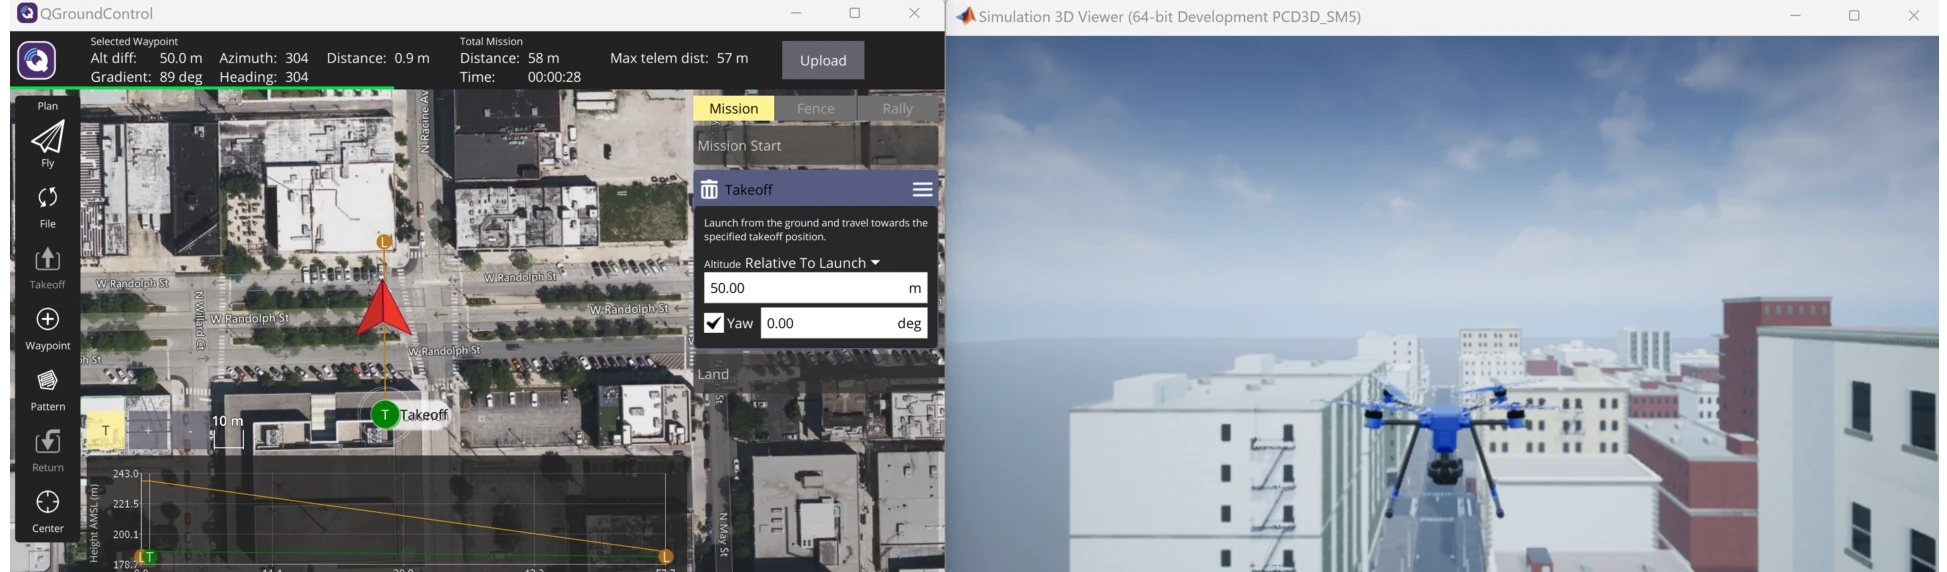
A MATLAB/Simulink UAV flight simulator, QGroundControl mission planning, an urban 3D environment, monocular image sequences, camera intrinsics, attitude and altitude inputs, and simulated reference positions.
 Open figure —
Flight-simulator setup: mission planning in QGroundControl and the 3D simulated environment.
Measurement Uncertainty Model for Relative Visual Localization of UAV, Fig. 4, p. 4.Method
From input to interpretable output
Feature extraction and matching feed a relative visual-localization model. The companion sensitivity study compares classical features and semantic segmentation while propagating input uncertainties through the modeled VIO measurement chain.
 Open figure —
Adopted monocular VO localization workflow.
Measurement Uncertainty Model for Relative Visual Localization of UAV, Fig. 1, p. 2.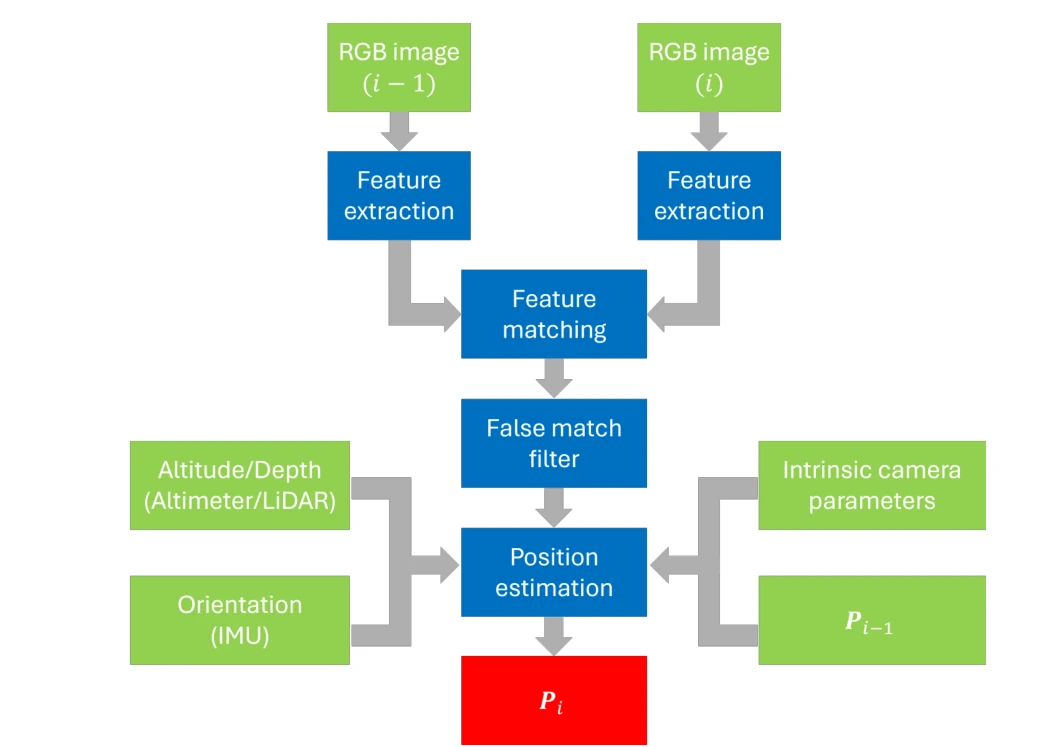 Open figure —
Modeled VIO workflow used for the sensitivity analysis.
Sensitivity Analysis of a Visual Inertial Odometry-Based Navigation System for UAV, Fig. 1, p. 2.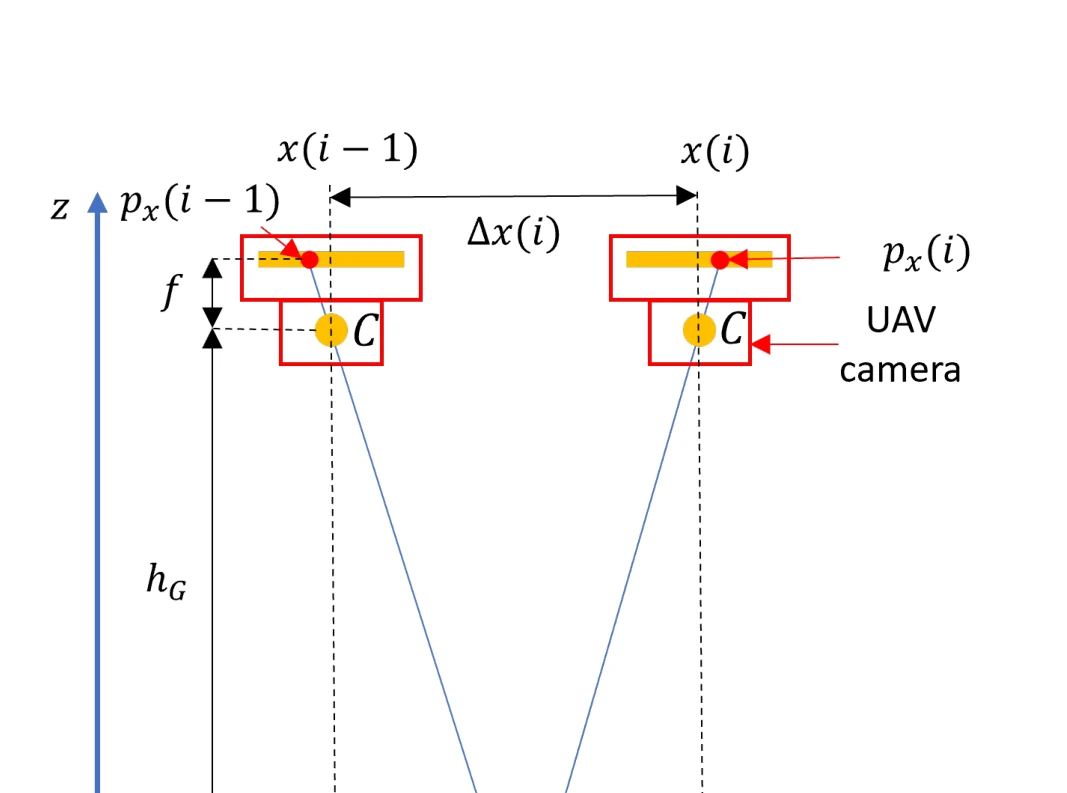 Open figure —
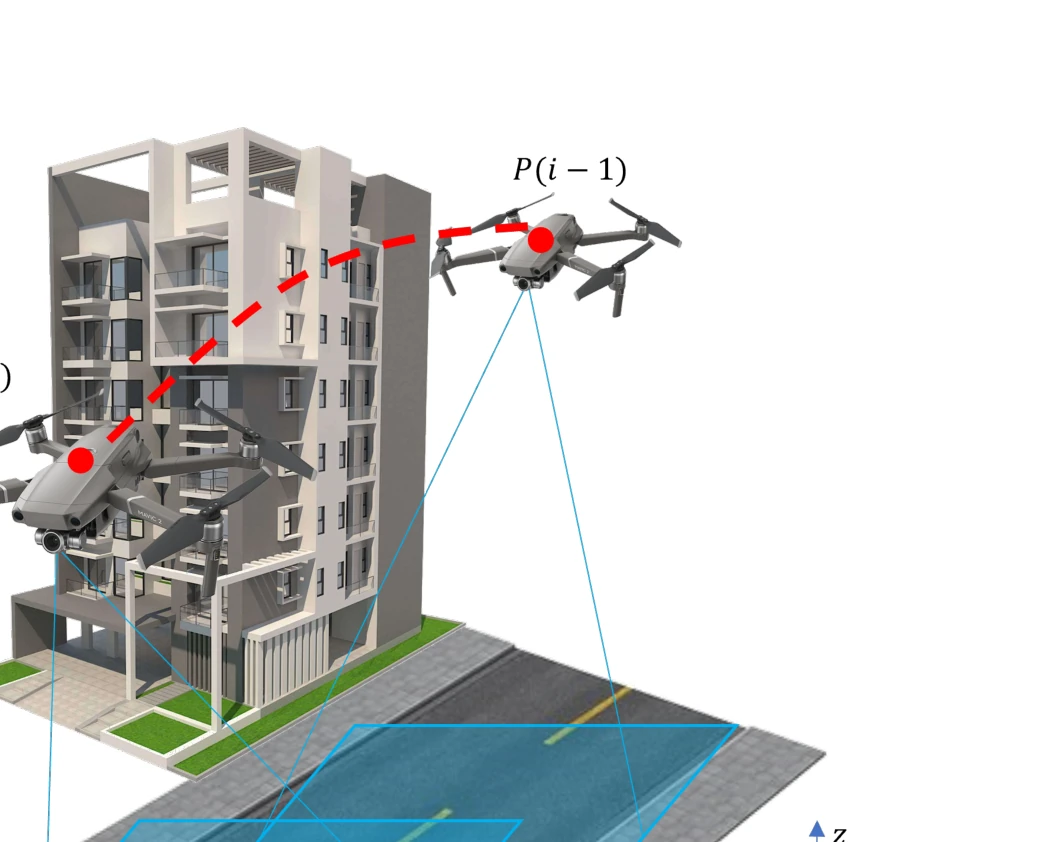
Geometry used to propagate image and sensor uncertainty into position estimates.
Measurement Uncertainty Model for Relative Visual Localization of UAV, Fig. 2, p. 3.Results
Reported results
feature localization uncertainty
semantic segmentation; VIO simulation study
feature localization uncertainty
ORB, best traditional method in the comparison
maximum trajectory error
simulated flight; ORB and semantic segmentation
 Open figure —
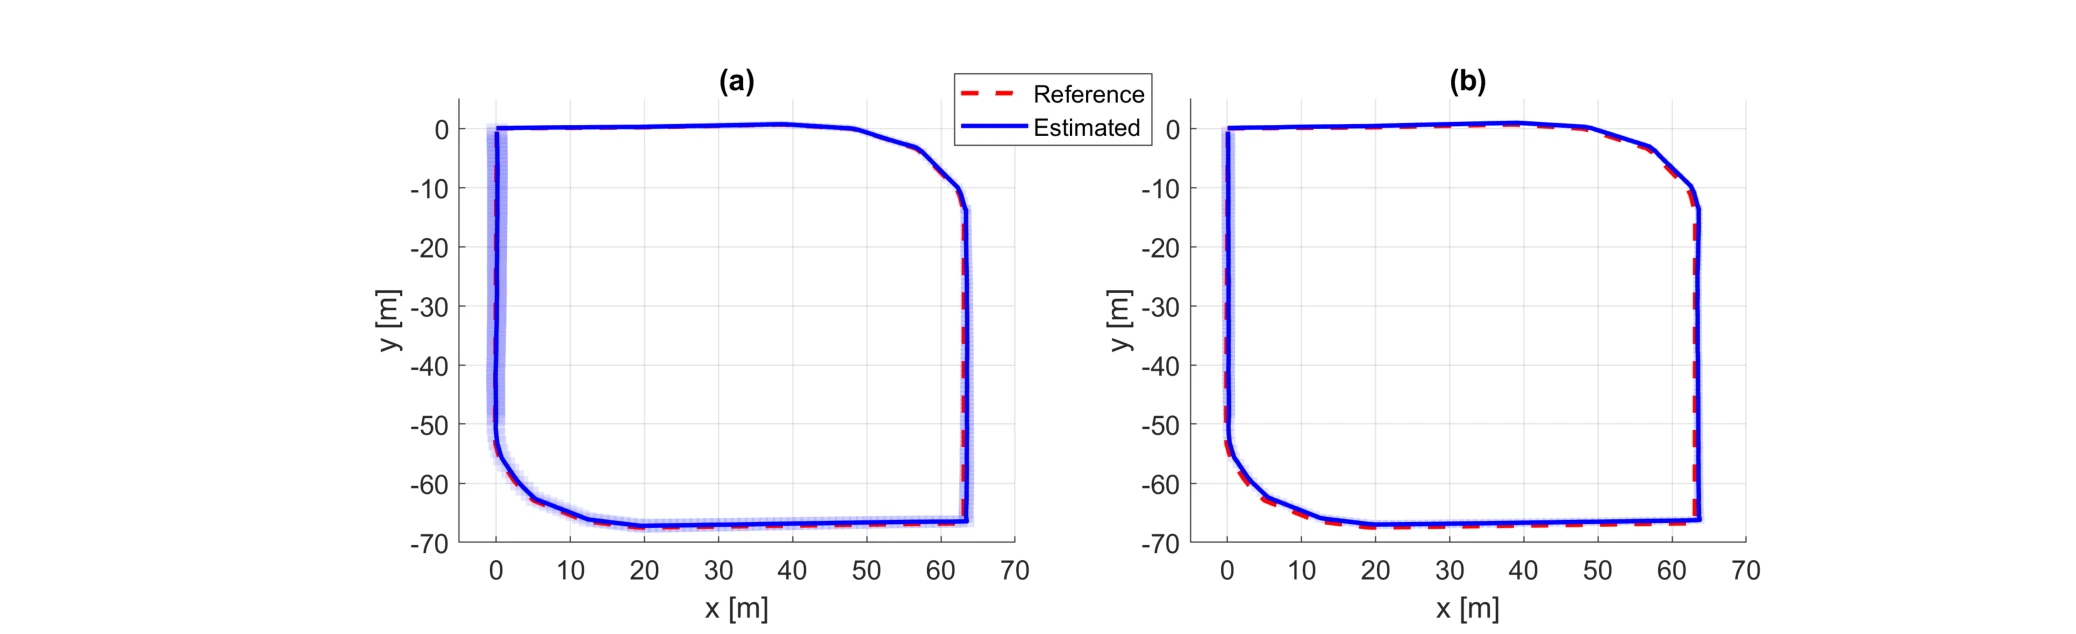
Estimated trajectories and uncertainty intervals for ORB and semantic segmentation.
VIO Sensitivity Analysis, Fig. 3, p. 5.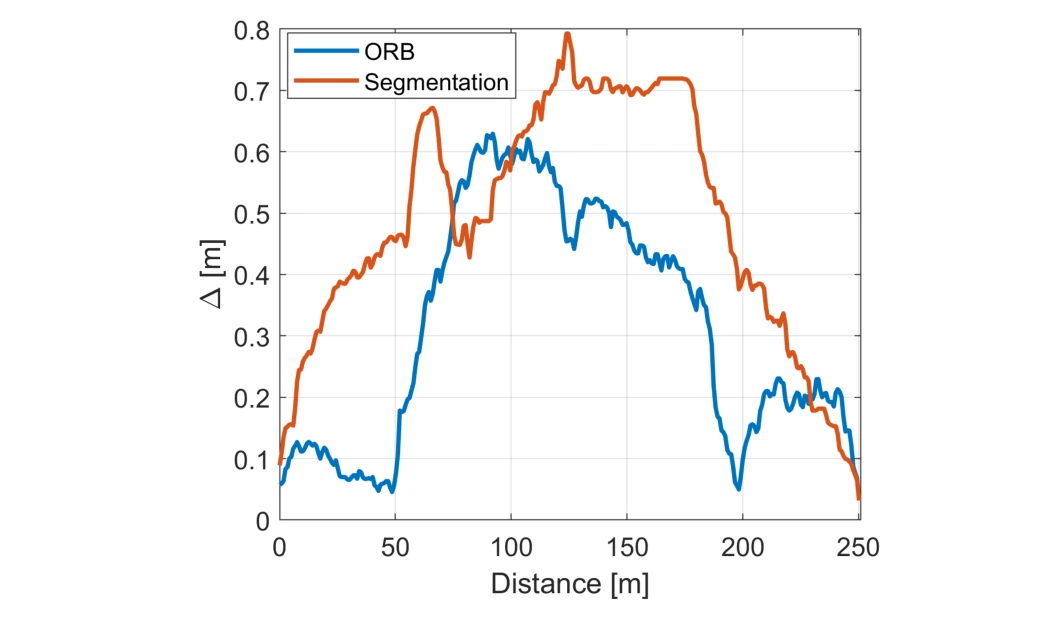 Open figure —
Euclidean distance from the reference trajectory for the two feature pipelines.
VIO Sensitivity Analysis, Fig. 4, p. 5.Validation & uncertainty
Reference and uncertainty checks
Estimated trajectories are compared with simulator reference coordinates. Expanded uncertainty bands and feature-method comparisons show where the estimate is precise, where drift accumulates, and how the selected visual representation changes the result.
 Open figure —
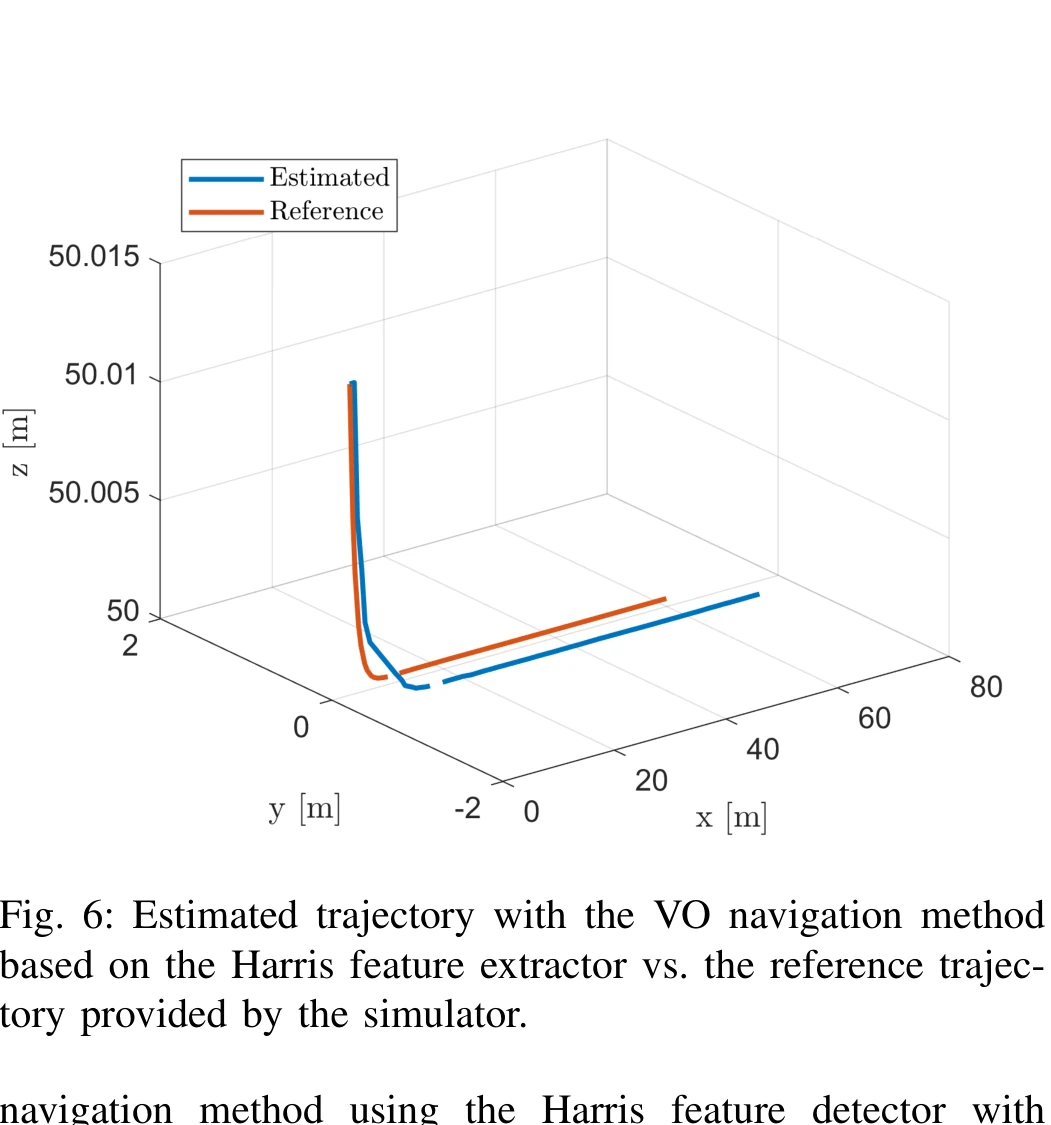
Harris-based visual-odometry trajectory versus the simulator reference.
Measurement Uncertainty Model for Relative Visual Localization of UAV, Fig. 6, p. 5.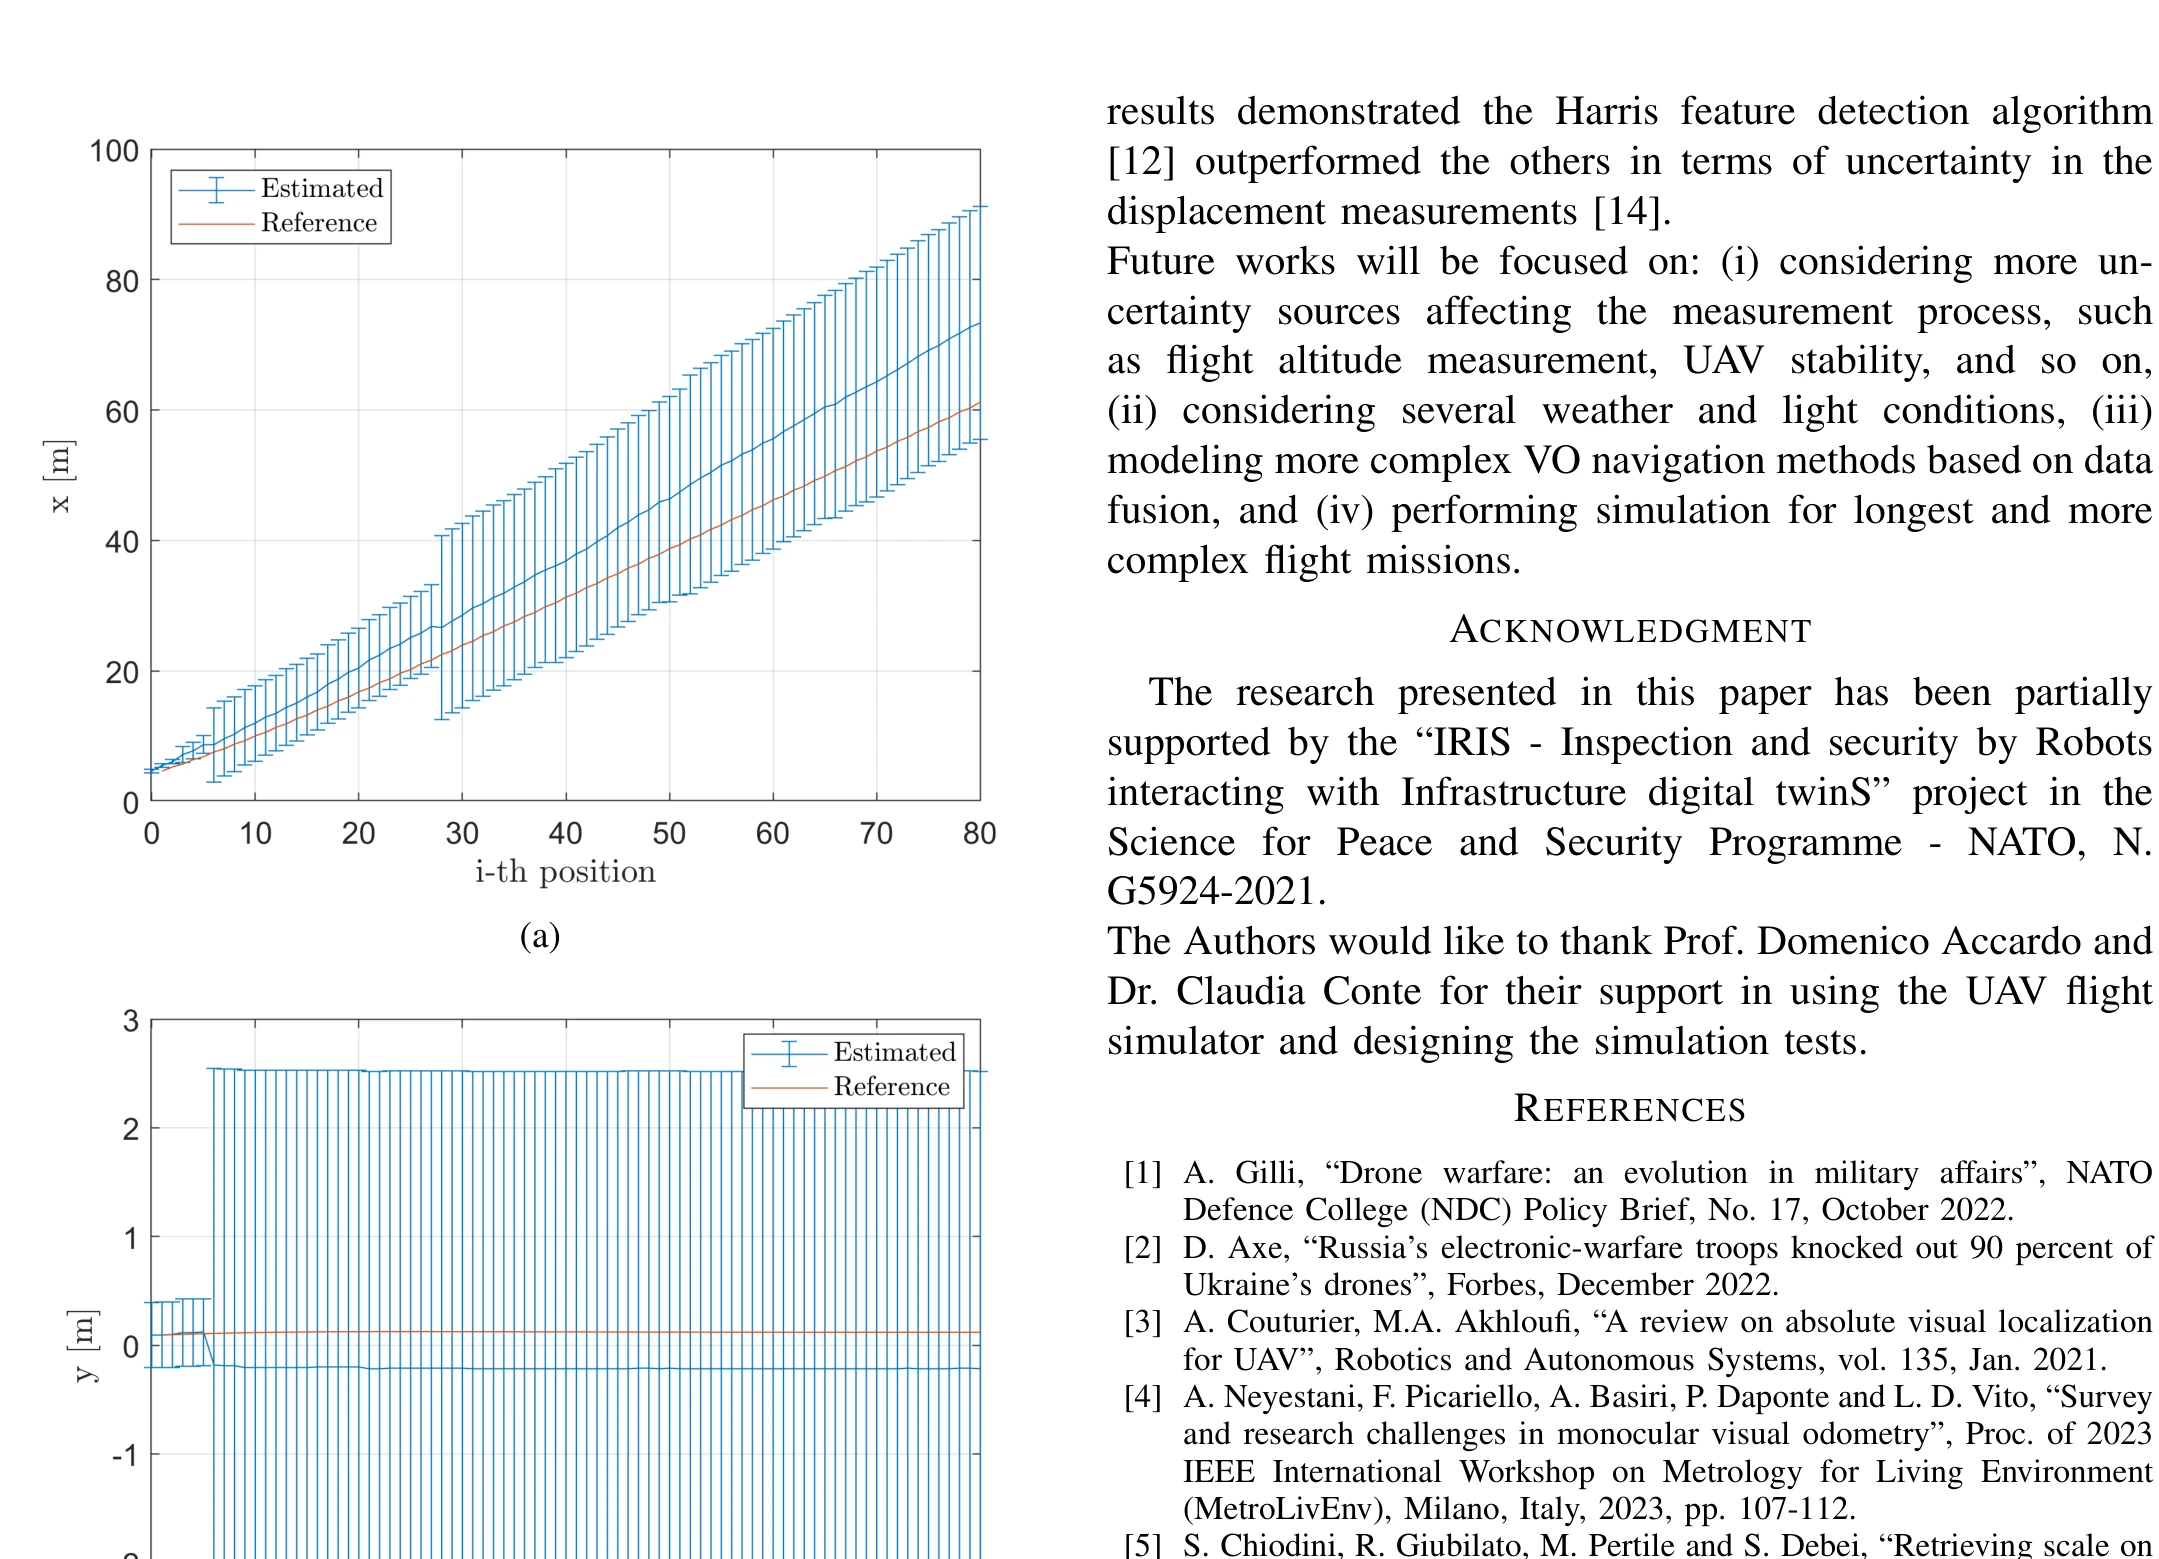 Open figure —
Estimated coordinates with expanded uncertainty along both axes.
Measurement Uncertainty Model for Relative Visual Localization of UAV, Fig. 7, p. 6.Limitations & failure modes
Operating limits and failure modes
 Open figure —
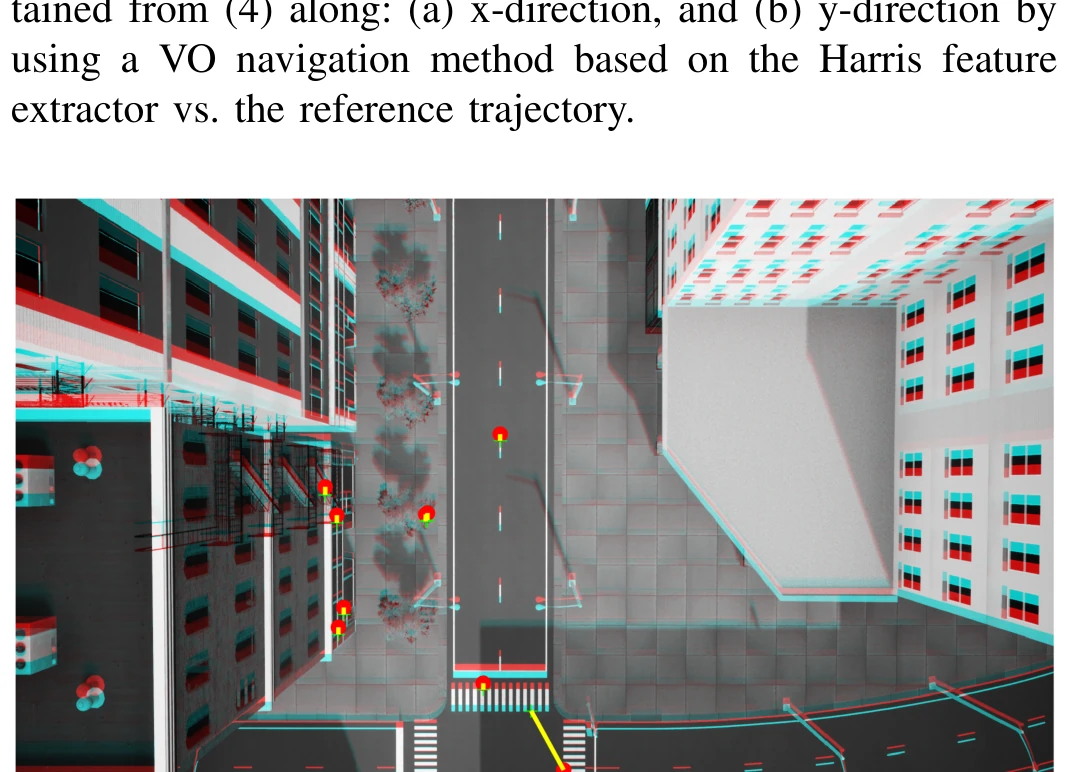
Disparity map used to inspect the image-based localization input.
Measurement Uncertainty Model for Relative Visual Localization of UAV, Fig. 8, p. 6.Low texture, repeated structures, mismatches, disparity error, camera-calibration error, altitude and attitude uncertainty, motion blur, and scene-domain shift can all degrade the estimated trajectory.
The results are simulation-based and do not establish field performance under arbitrary weather, flight dynamics, camera hardware, or GNSS-denied operational conditions.
Technical stack
Tools selected for the measurement chain
- MATLAB
- Simulink
- QGroundControl
- Monocular VO
- Visual-inertial odometry
- Uncertainty propagation
Sources & project links
Papers and code
MetroAeroSpace 2023 relative-localization uncertainty paper and I2MTC 2024 VIO sensitivity paper. All displayed trajectories and uncertainty plots are publication figures.