
Problem
What needed to be understood or measured
Marine monitoring systems need compact, reproducible inference that preserves the preprocessing used during model development.
My contribution
My contribution
I led the study as first author, developing preprocessing, data splits, multivariate GRU modeling, and evaluation with my co-authors.
Experimental setup
Data and setup
Four wave features over a 16-step look-back window, evaluated across Tarragona, Barcelona, and EMSO-OBSEA measurements.
 Open figure —
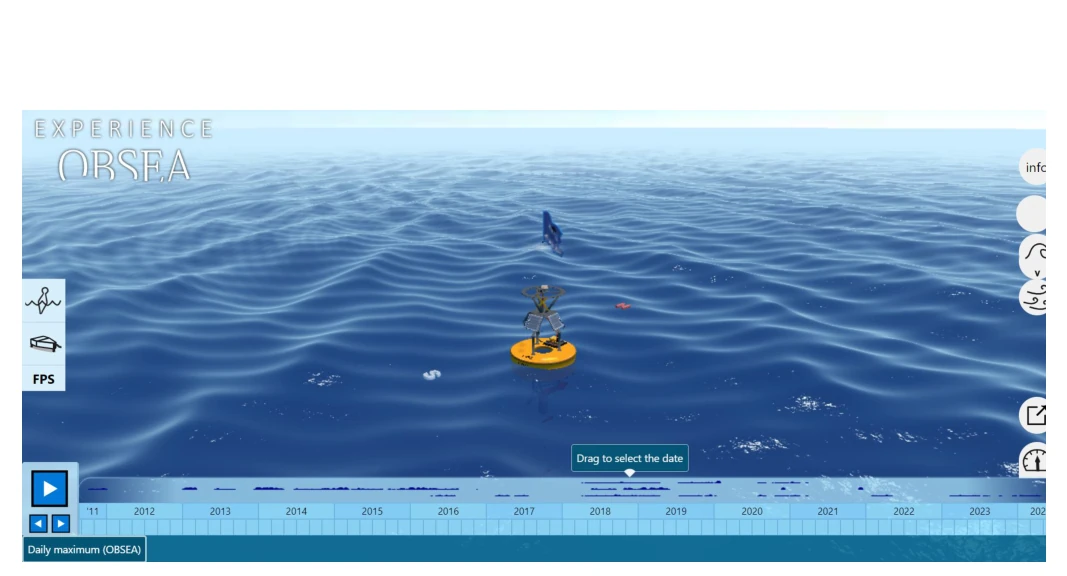
OBSEA observatory and buoy data represented in the marine digital-twin interface.
A Significant Wave Height Data-Driven Modeling for Digital Twins of Marine Environment, Fig. 1, p. 2.Method
From input to interpretable output
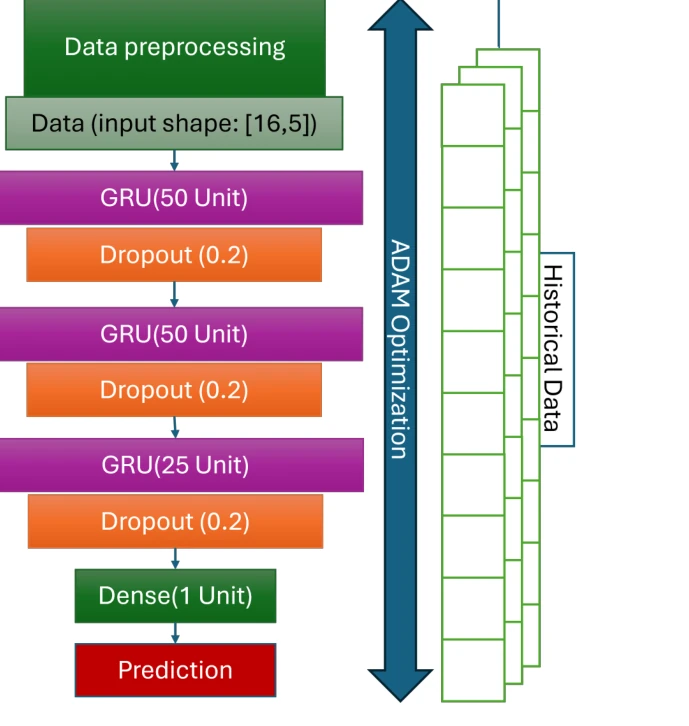
A three-layer GRU predicts the next VHM0 value. The repository packages the trained model, fitted scalers, sample data, validation, and a deterministic inference interface.
 Open figure —
Published GRU architecture and 16-by-5 input sequence.
Significant Wave Height paper, Fig. 2, p. 2.Results
Reported results
best reported RMSE
Barcelona evaluation
best reported Pearson r
Barcelona evaluation
MAE
Tarragona evaluation
RMSE
Tarragona evaluation
 Open figure —
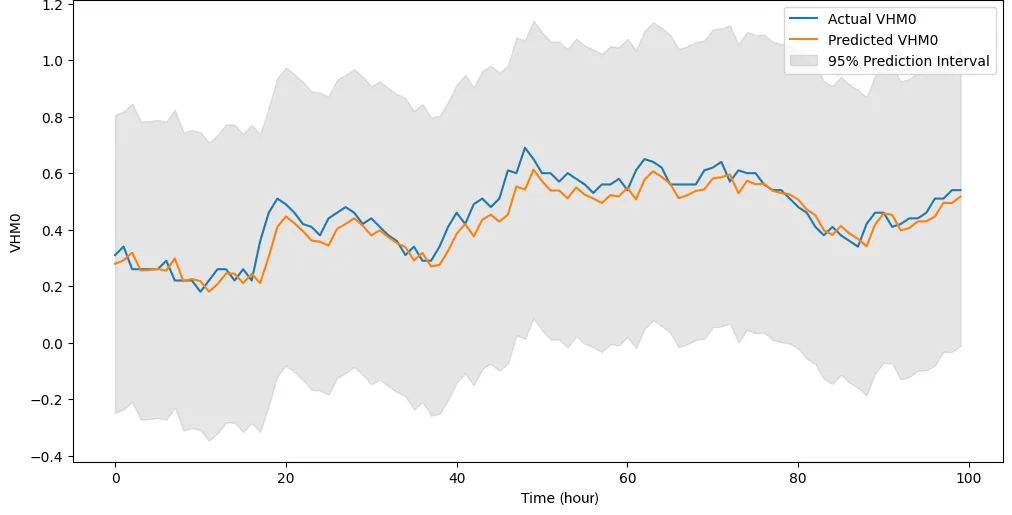
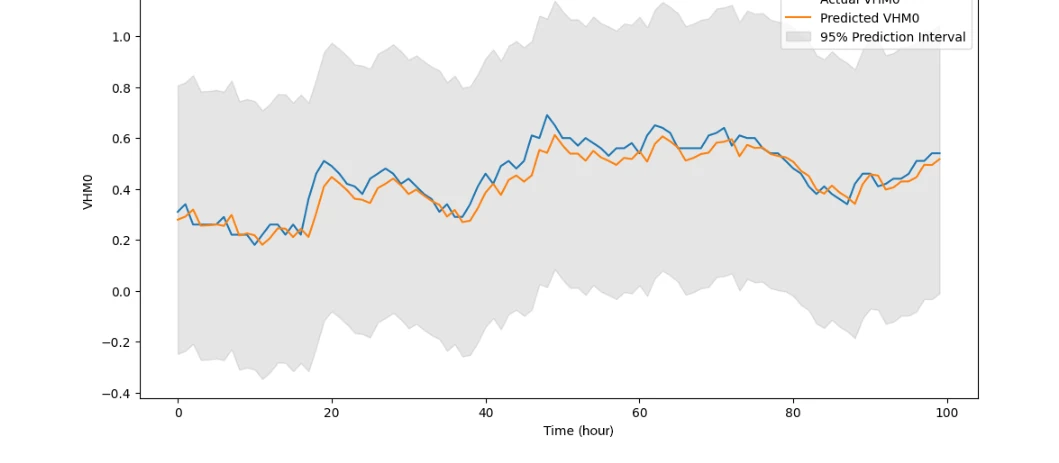
Barcelona actual and predicted VHM0 with the published 95% prediction interval.
Significant Wave Height paper, Fig. 4, p. 4.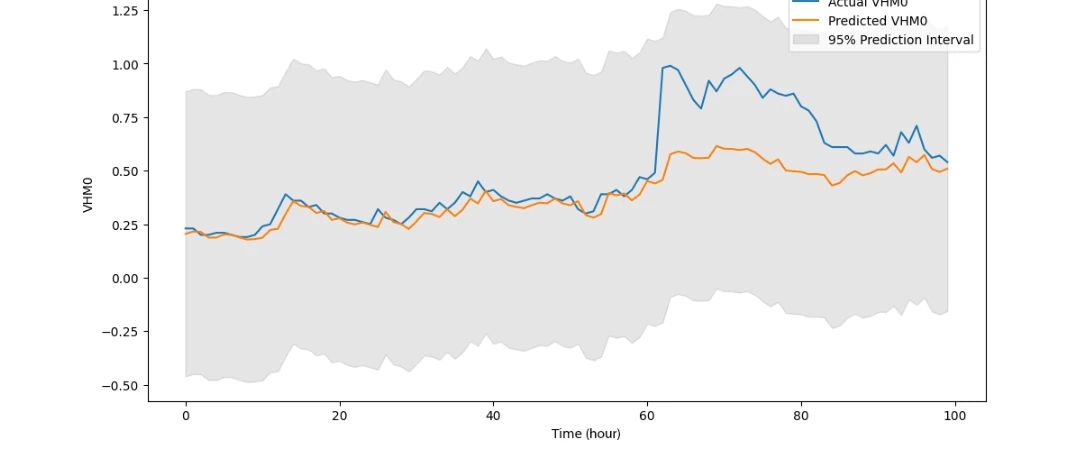 Open figure —
EMSO-OBSEA actual and predicted VHM0 with the published prediction interval.
Significant Wave Height paper, Fig. 7, p. 5.Values reported in the 2024 IEEE MetroSea paper. Bars use separate scales and are labeled directly.
Validation & uncertainty
Reference and uncertainty checks
Metrics are reported per measurement site in the paper. The repository provides inference assets and checks, but intentionally does not include a retraining pipeline.
 Open figure —
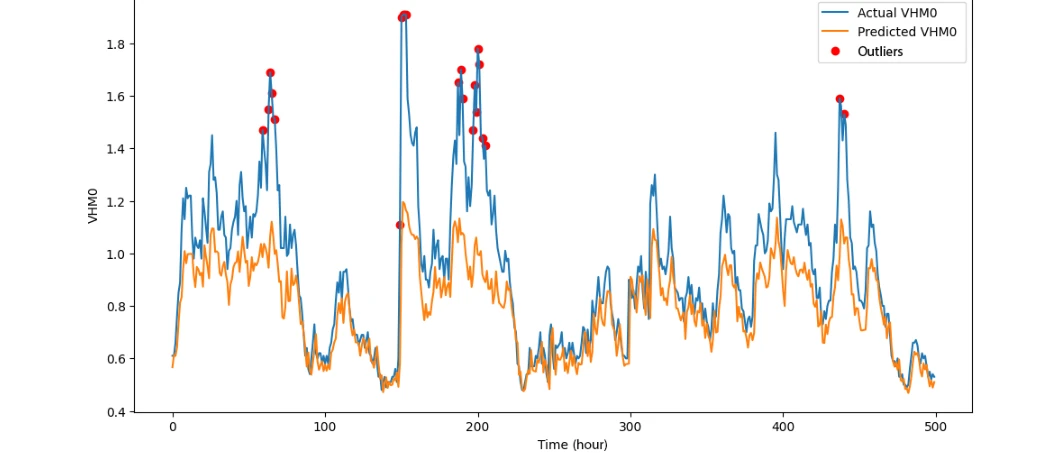
Barcelona time series with residual-based outliers flagged.
Significant Wave Height paper, Fig. 5, p. 4.Limitations & failure modes
Operating limits and failure modes
 Open figure —
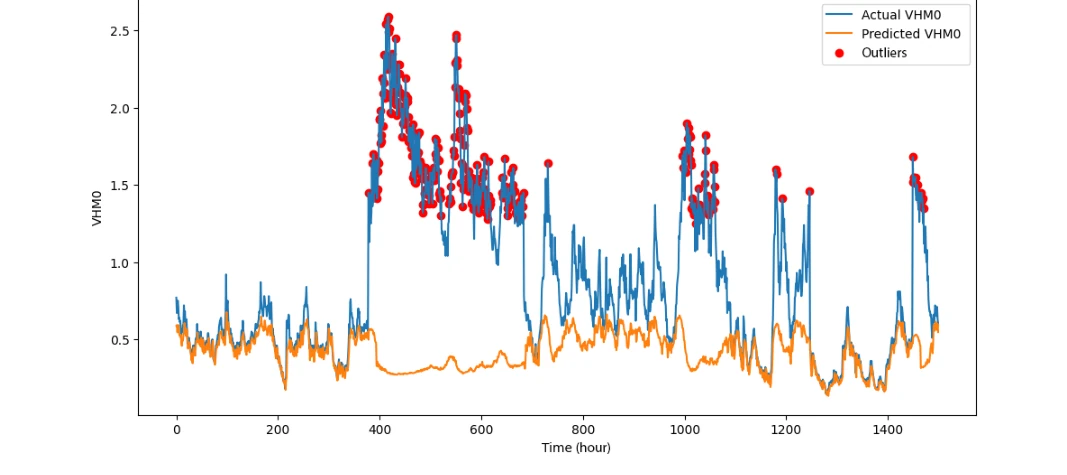
EMSO-OBSEA prediction series with flagged outliers.
Significant Wave Height paper, Fig. 8, p. 5.Distribution shift between sites, missing observations, sensor drift, extreme sea states, and preprocessing mismatch can reduce forecast quality.
The repository is inference-ready but intentionally does not include a retraining pipeline. Metrics shown here are paper results, not newly recomputed benchmarks.
Technical stack
Tools selected for the measurement chain
- Python
- TensorFlow
- GRU
- Time-series preprocessing
- Saved scalers
- Deterministic inference
Sources & project links
Papers and code
IEEE MetroSea 2024 paper and MIT-licensed public inference repository. Metrics shown here are paper results, not newly recomputed benchmarks.